
A wind turbine delivery plan is not a parcel-routing problem with larger trucks. Blades, towers, nacelles, and other components move through a project supply chain where the wrong sequence can strand installation crews, force temporary storage, or turn a low-cost transport choice into a higher installed cost. That is the useful entry point for the GE Vernova supply chain AI case: logistics is large enough to matter, and the physical constraints are awkward enough that static planning leaves money on the table.
GE Vernova reported that logistics accounts for 10–15% of total wind turbine installation cost, which makes it a material cost pool rather than an administrative afterthought.[1] The company’s AI/ML work targeted that cost pool by modeling the delivery pipeline from supplier to installation site, not just by selecting a cheaper lane or carrier in isolation.[1]
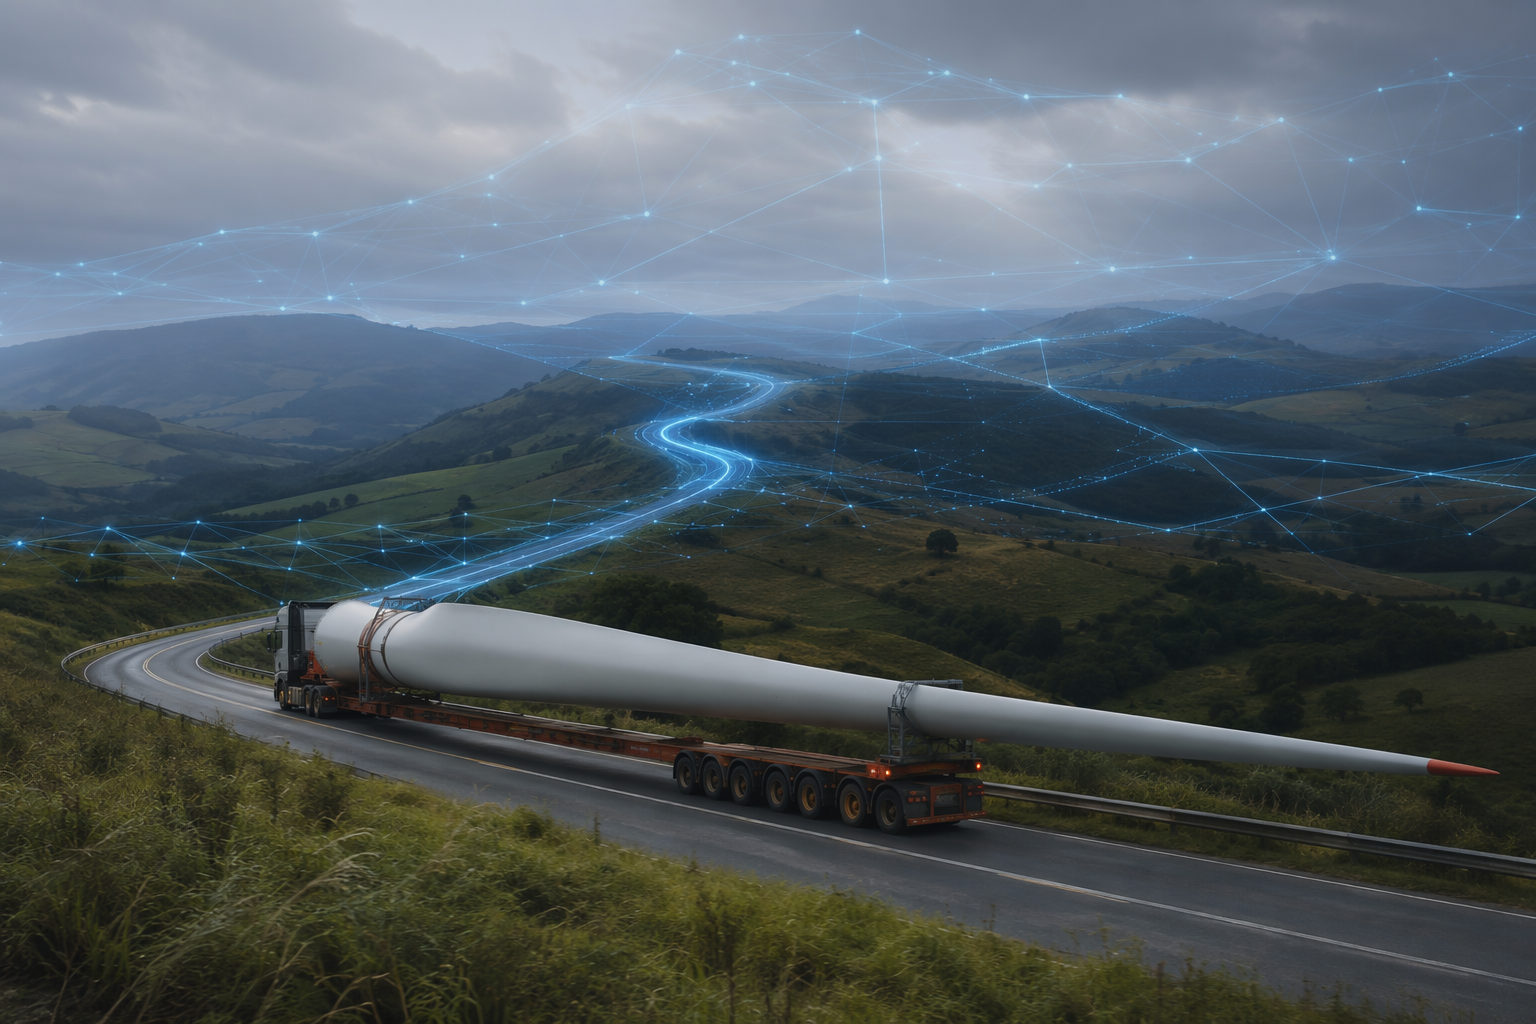
What GE Vernova Actually Modeled
The work began before GE Vernova became an independent company. GE Research collaborated with GE Renewable Energy on the wind logistics AI/ML tool, and the program is now commonly discussed in the context of GE Vernova’s energy transition technology portfolio.[2] That history matters because the measured deployment should be read as a GE Research and GE Renewable Energy implementation that later became part of the GE Vernova story, not as a newly disclosed 2026 operating metric.
The core system was a predictive digital twin of the onshore wind turbine logistics pipeline. GE described the model as representing suppliers, supplier locations, regulations, costs, and shippers, using historical and industry data to evaluate how components move from supplier to installation site.[1] In practical terms, the model had to see a project delivery network rather than a transportation event.
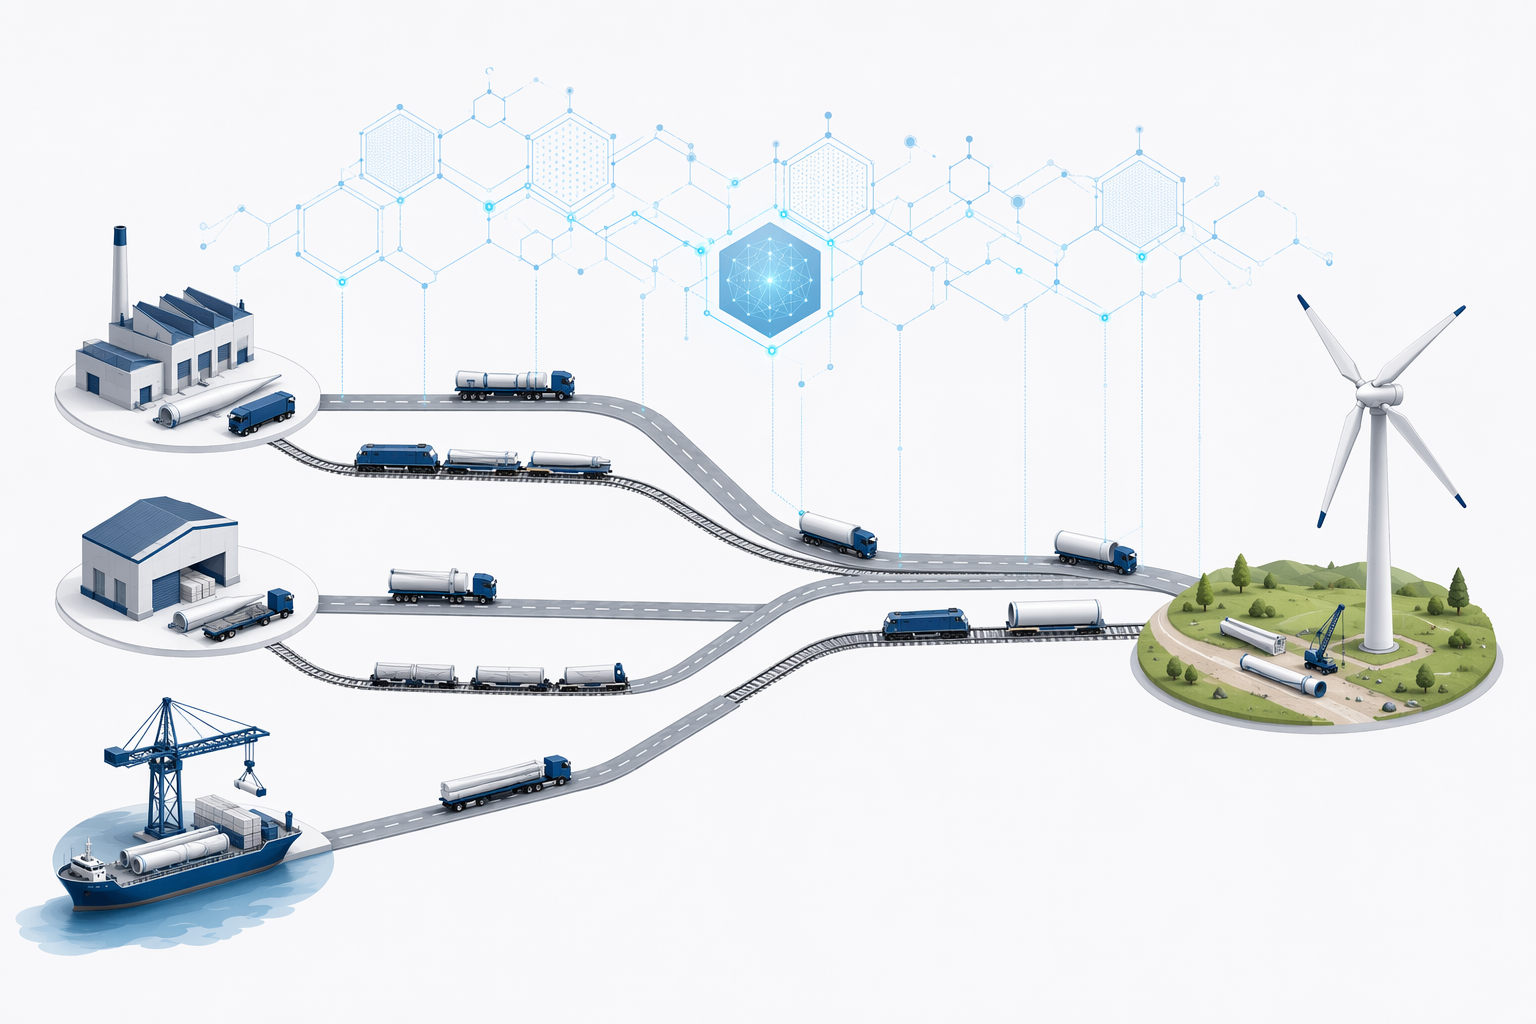
That distinction is where the case becomes more interesting than a generic AI planning claim. A turbine component can be cheap to move on one leg and expensive to handle later. A carrier choice can look attractive until route restrictions, delivery timing, or site readiness are included. A supplier location can change the economics of the entire installation sequence. The value of the digital twin sits in those interactions.
| Layer | What it represents | Why it matters |
|---|---|---|
| Inputs | Historical data, industry data, supplier locations, regulations, costs, and shippers | The model needs enough factual coverage to compare realistic project options |
| Modeled decisions | How turbine components move from suppliers to installation sites across available transport options | The tradeoff is end-to-end delivered cost, not the apparent price of one movement |
| Cost impact | Validated logistics cost reduction over a bounded test period | The strongest evidence is measured performance, not the global projection |
The Measured Result: 10% Over 10 Months
The most important number in the case is the bounded one: GE reported that the tool demonstrated a 10% logistics cost reduction over a 10-month validation period in 2021.[1] That figure is valuable because it is tied to a defined use case, a defined cost category, and a defined time window.
It should not be inflated into a universal AI savings benchmark. The validation does not say that every wind project will reduce logistics cost by 10%, or that every heavy equipment supply chain can apply the same model and get the same result. It says that, in this onshore wind turbine logistics context, an AI/ML digital twin reduced logistics cost during a measured 10-month test.
GE also estimated that the approach could deliver $1.7–2.6 billion in annual global savings by 2030.[1] That is a projection, not a realized savings figure. It is still worth noting because the addressable cost base is large, but it belongs in a different evidentiary category from the 2021 validation.
| Claim | Evidence type | How to read it |
|---|---|---|
| 10% logistics cost reduction over 10 months in 2021 | Validated result reported by GE | Strongest proof point for the specific wind logistics tool |
| $1.7–2.6 billion in annual global savings by 2030 | Projected global savings estimate | Useful for scale of opportunity, not proof of realized value |
| 2022 Manufacturing Leadership Award | External recognition | Credibility signal, not a substitute for cost validation |
Why the Savings Came From System Visibility, Not Route Optimization Alone
The supply chain lesson is not that AI found shorter routes for oversized cargo. The stronger reading is that the model made project logistics visible as a connected system. Supplier geography, shipper availability, costs, and regulatory limits are not independent variables once installation sequencing enters the picture.
For a logistics leader, the hard part is often not deciding whether a component can move. It is deciding which movement plan leaves the installation site, carriers, permits, staging yards, and project schedule in the least expensive workable state. The digital twin gave GE a way to compare those states before the physical network absorbed the consequences.
That is also why the case sits closer to a project control-tower problem than to conventional transportation procurement. A control tower that only reports where assets are may improve visibility, but this kind of model tries to represent cost consequences before choices are locked in. Readers comparing architectures may find the distinction useful when placing digital twins beside broader visibility systems such as ChainSignal’s article on three control tower models and why only one delivers ROI.
Credibility, With a Boundary Around the Evidence
The tool earned a 2022 Manufacturing Leadership Award from the National Association of Manufacturers.[1] That recognition helps separate the project from a slideware AI claim, but the award is secondary evidence. The cost reduction and the modeled logistics scope carry the argument.
There is also a timing caveat. GE Vernova became an independent company in April 2024, after the original GE Research and GE Renewable Energy work.[2] GE Vernova continues to publish material on AI and digital twin capabilities, including its digital twin technology page, but the sources available here do not explicitly reconfirm the current post-spin-off operational status of this exact wind logistics tool.[3] The safest wording is that this is a documented GE Research and GE Renewable Energy deployment now relevant to GE Vernova’s supply chain AI narrative.
Where the Lesson Transfers
The case travels best to capital equipment supply chains that resemble onshore wind turbine delivery in three ways: the data exists, the logistics network is genuinely complex, and delivered cost depends on project-specific coordination rather than repeated replenishment. Without those conditions, the model may still be interesting, but it becomes a weaker benchmark.
- Comparable data availability: the organization can describe suppliers, locations, transport options, cost structures, and constraints with enough consistency for a model to compare scenarios.
- Comparable logistics complexity: the freight is large, constrained, sequenced, or difficult enough that one movement choice changes downstream cost.
- Comparable project variability: the network changes by project, site, supplier mix, or regulation, so a static template cannot carry the full decision burden.
- Comparable cost exposure: logistics is material to total installed cost, not a small operating expense hidden inside a larger production process.
That makes the case relevant beyond wind, but not automatically portable. Large transformers, grid equipment, industrial modules, and other project-delivered assets can share some of the same conditions. ChainSignal’s article on how AI tackles the transformer bottleneck in grid supply chains is a useful adjacent comparison because it also sits inside energy infrastructure, where long lead times and physical constraints matter.
Offshore wind is adjacent but not identical. Offshore logistics introduces vessel availability, weather windows, marine coordination, and installation constraints that differ from onshore turbine delivery. For readers comparing patterns rather than copying assumptions, ChainSignal’s pieces on where AI delivers the highest ROI in offshore wind supply chain, AI saving $300K per day in offshore wind construction logistics, and how AI cuts offshore wind logistics costs by 10–36% provide better offshore-specific comparison points.
The Practical Reading of the GE Vernova Case
GE Vernova’s wind logistics case is useful because it puts AI into a difficult physical setting: oversized equipment, multiple suppliers, project-bound delivery, transport constraints, and installation economics. The validated 10% reduction over 10 months gives logistics and AI leaders a real proof point, provided it remains attached to the conditions that produced it.[1]
The case does not prove that every heavy manufacturing supply chain should expect the same return. It also does not convert the $1.7–2.6 billion 2030 estimate into realized value.[1] The right test is narrower: if a supply chain has the data richness, project variability, and logistics cost exposure of onshore wind turbine delivery, this case is highly relevant. If it does not, GE Vernova’s digital twin is still a signal, but not a benchmark to copy directly.
References
- GE Using AI/ML to Reduce Wind Turbine Logistics and Installation Costs, GE Vernova
- GE Vernova: What is AI's role in the energy transition, AI Magazine
- Digital Twin Technology, GE Vernova
Comments
Join the discussion with an anonymous comment.