The Factory AI Paradox: Sophisticated Twins, Static Plans
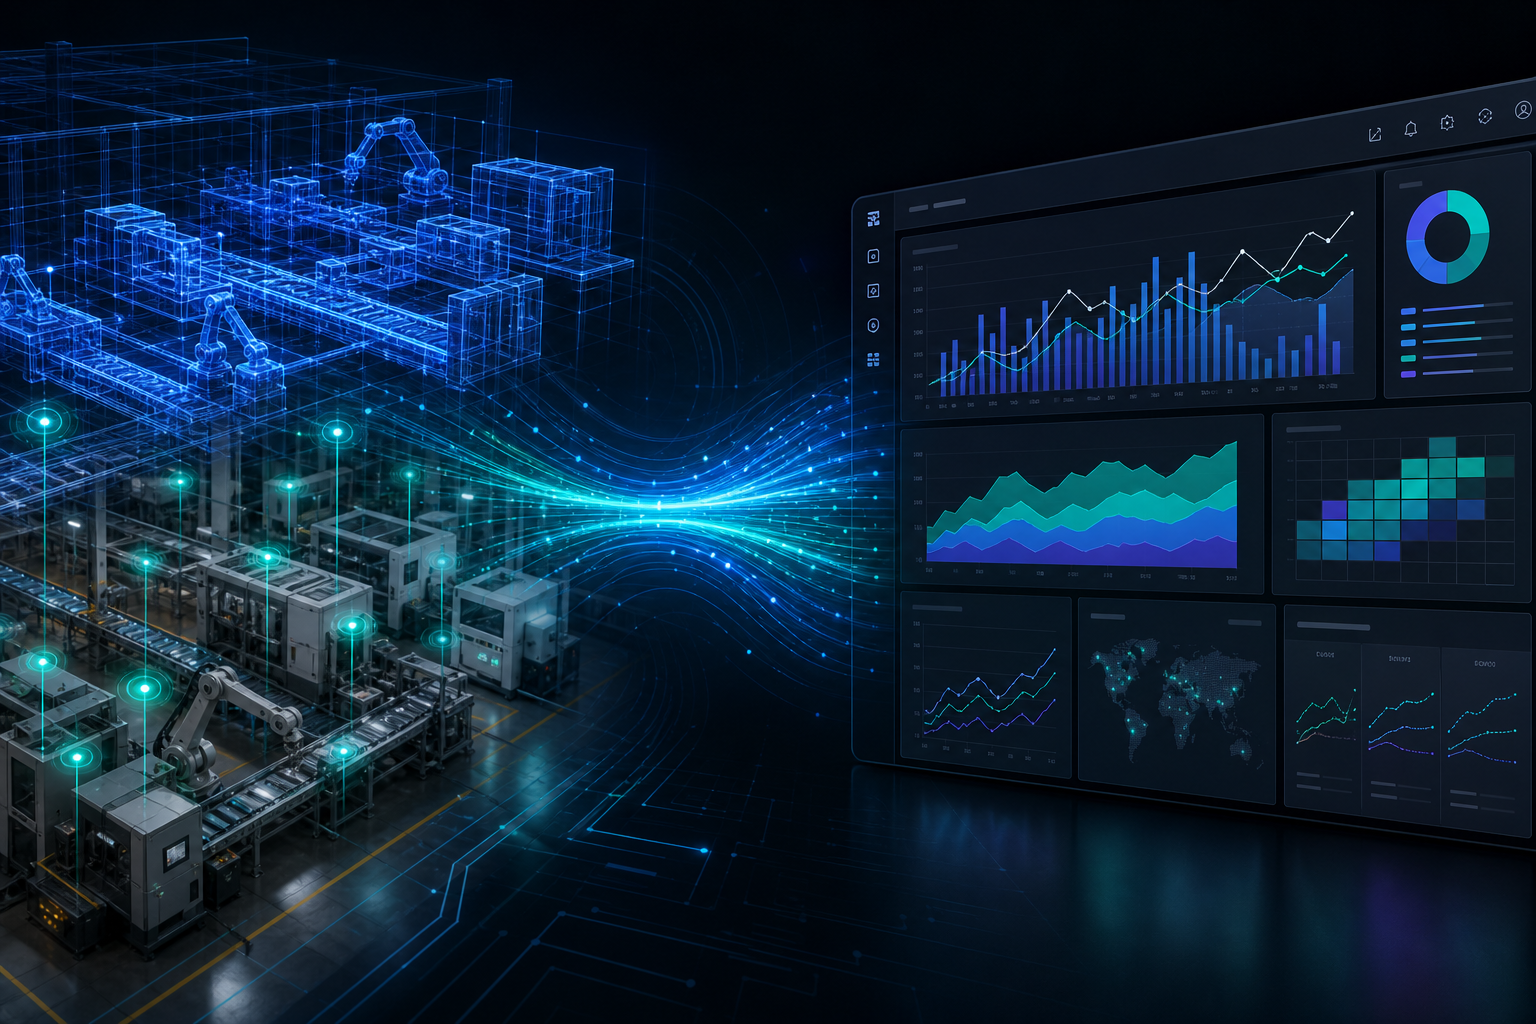
Manufacturers have spent years building factory digital twins that track machine availability in real time, simulate production bottlenecks before they occur, and generate predictive maintenance signals that prevent unplanned downtime. The shop floor has never been more instrumented. Yet walk into most S&OP meetings and the capacity figures on the table are the same ones that were there a year ago: assumed throughput rates, estimated utilization percentages, and constraint maps drawn from last quarter's production data.
The twin and the plan exist in separate worlds. The twin optimizes within the factory walls. The S&OP process optimizes against a model of the factory that no longer reflects reality. The strategic cost is not abstract: supply plans built on assumed capacity produce commitments that the factory cannot keep, or leave capacity on the table that the factory could deliver. Every week the gap persists is a week of planning quality that was never captured.
This guide is not about what digital twins are. It is about how their outputs cross the boundary into enterprise supply chain planning — the architecture required, the organizational conditions that must be in place, and the platform options available in 2026 to manufacturers who are ready to close the gap.
What a Factory Digital Twin Actually Produces
Before discussing integration, it is worth being precise about what a production or process digital twin generates — because the data types matter for understanding where and how they enter planning systems.
A process digital twin, as distinct from a component or asset twin, provides a view of how systems work together across a production facility or operational workflow. It is not monitoring a single machine; it is modeling the production environment as an interconnected system. The outputs include:
- Overall Equipment Effectiveness (OEE) by line, cell, or facility — updated continuously rather than reported weekly.
- Throughput rates under current and projected operating conditions, including the effect of scheduled and unscheduled downtime.
- Machine availability forecasts derived from predictive maintenance models, expressed as probability distributions over planning horizons.
- Constraint maps identifying which resources are bottlenecks under different product mix or volume scenarios.
- Simulation outputs from what-if runs — for example, what happens to throughput if a specific line is taken offline for maintenance during a peak demand period.
- Real-time production state data: work-in-progress levels, queue depths, changeover status, and yield rates.
Siemens describes the combination and integration of product, production, and performance twins as a digital thread — a connected data view that spans the full lifecycle of both the product and the production process. Within that framework, the process twin is the layer most directly relevant to supply chain planning: it simulates and analyzes the behavior of physical processes and enables real-time monitoring and optimization of production workflows.
| Twin Type | What It Models | Primary Output for S&OP |
|---|---|---|
| Asset / Component Twin | Individual machine or equipment unit | Predictive maintenance signals, asset availability |
| Process Twin | Production line or facility as a system | OEE, throughput rates, constraint maps, simulation outputs |
| Performance Twin | Operational KPIs across production and supply chain | Capacity utilization trends, efficiency benchmarks |
| Digital Thread | Connected data across product, production, and performance layers | Organization-wide view for cross-functional planning |
Why the Gap Persists: Cadence, Ownership, and System Silos
The disconnect between factory digital twins and S&OP is not primarily a technology problem. The technology to bridge them has existed in some form for several years. The gap persists because of three structural conditions that technology alone cannot fix.
The OT/IT Divide
Operational technology (OT) systems — PLCs, SCADA, MES, and the IoT infrastructure feeding the digital twin — are governed, maintained, and secured by engineering and plant operations teams. Information technology (IT) systems — ERP, APS, IBP, and S&OP platforms — are governed by supply chain and IT organizations. These two stacks have different security models, different update cadences, different data schemas, and different organizational owners. Connecting them requires deliberate bridge architecture and cross-functional governance, neither of which emerges naturally.
Ownership Fragmentation
OT teams own the twin. Supply chain teams own S&OP. No one owns the bridge. In most manufacturing organizations, there is no role, team, or governance body with explicit accountability for ensuring that factory twin outputs flow into enterprise planning processes. The result is that both sides optimize locally and the integration never gets prioritized.
Horizontal Integration Remains the Exception
McKinsey's Industry 4.0 research found that only 38% of manufacturers surveyed were looking at horizontal integration beyond the four walls of the factory. That figure is directional evidence of a persistent structural gap, not a recent survey result — but the conditions it describes have not fundamentally changed. Planning has traditionally been conducted in silos, with demand forecasting, supply planning, production planning, logistics planning, and S&OP handled by separate teams. The same research notes that technology upgrades of suppliers' IT/OT systems may be required for end-to-end horizontal integration of data.
"The most resilient supply chains I have encountered were not the most automated — they were the most integrated. Automation without integration can create the illusion of control while increasing systemic brittleness."
That observation, from a senior manager at Procter & Gamble writing in Supply Chain Dive in May 2026, captures the core failure mode: when planning systems, procurement, operations, and logistics each optimize locally, automation accelerates competing objectives rather than resolving them. The digital-twin-to-S&OP gap is a specific instance of this broader integration failure.
- Sequential planning models — demand first, then supply, then logistics — cannot absorb real-time factory signals without becoming incoherent. Concurrent planning is a prerequisite for live twin integration.
- Data latency between OT refresh rates (seconds to minutes) and S&OP consumption windows (weekly or monthly) must be explicitly managed, not ignored.
- Without a single-version-of-factory-truth governance model, OT and IT systems will produce conflicting capacity figures, and planners will default to whichever number they trust more — usually neither.
Integration Architecture Patterns: OT-IT Bridge to APS Connector
Four architectural patterns are in active use for connecting factory digital twin data to enterprise planning systems. They are not mutually exclusive — most production deployments combine elements of all four.
Pattern 1: The OT-IT Bridge
The most concrete reference architecture for this pattern is the Azure Digital Twins PaaS stack: IoT devices on the factory floor connect to IoT Hub, which feeds live data into the digital twin graph. From there, event routes using Event Hubs, Event Grid, and Service Bus push twin-state changes to downstream services — analytics platforms, planning systems, or workflow automation via Logic Apps. This is a platform-agnostic pattern; the same logical flow applies with other cloud IoT and twin platforms. The key design requirement is that the bridge must handle both the high-frequency OT data stream and the lower-frequency planning system consumption window without data loss or excessive latency accumulation.
Pattern 2: The Digital Thread
Where the OT-IT bridge moves data between systems, the digital thread connects data across departments, processes, and environments to produce an organization-wide view. Siemens describes the digital thread as the combination and integration of product, production, and performance twins as they evolve together. For supply chain planning purposes, the thread is what makes factory state data consumable at the enterprise level: it provides the semantic layer that translates OT data into planning-relevant signals (available capacity, constraint severity, maintenance risk horizon) rather than raw machine telemetry.
Pattern 3: Event-Driven APIs
Event-driven API architecture allows downstream planning systems to subscribe to factory state changes rather than polling for data on a fixed schedule. When the digital twin detects a capacity constraint change — a machine entering a degraded state, a maintenance window moving earlier than planned — an event is published to a message bus and consumed by the APS or IBP platform. This pattern aligns the data delivery cadence with the significance of the event rather than with an arbitrary clock cycle, which is more appropriate for supply chain planning than either continuous streaming or batch file transfer.
Pattern 4: Direct APS/IBP Connectors
The most operationally efficient path, where available, is a native connector between the digital twin platform and the APS or IBP system. Kinaxis RapidResponse and SAP IBP both provide environments where real-time data can feed scenario evaluation directly. When a platform supports this natively, it eliminates the middleware layer and reduces both latency and integration maintenance burden. The tradeoff is vendor lock-in: native connectors are typically certified for specific twin platforms and may not support the full range of OT data sources in a given factory.
| Pattern | How It Works | Best Fit | Key Risk |
|---|---|---|---|
| OT-IT Bridge | IoT Hub → Digital Twin → Event routing to downstream systems | Greenfield or cloud-first OT environments | Requires OT security and network architecture changes |
| Digital Thread | Semantic data layer connecting product, production, and performance twins across departments | Multi-plant, multi-department integration | High implementation complexity; requires data governance upfront |
| Event-Driven APIs | Planning system subscribes to factory state change events | Environments with mature API infrastructure | Event schema design requires cross-functional agreement |
| Direct APS/IBP Connector | Native integration between twin platform and planning system | Organizations on aligned platform stacks | Vendor lock-in; connector coverage may be incomplete |
Where Digital Twin Outputs Enter the S&OP Cycle
The S&OP cycle has specific steps where factory twin data changes the quality of decisions. The integration is not a background data feed — it changes what questions planners can ask and how quickly they can answer them.
Rough-Cut Capacity Planning
Rough-cut capacity planning (RCCP) is the step where demand signals are tested against available production capacity to identify feasibility gaps before the detailed supply plan is built. Without twin integration, RCCP uses assumed capacity — historical throughput rates, standard utilization percentages, and scheduled maintenance windows that may or may not reflect actual factory state. With twin integration, RCCP draws on twin-simulated constraint maps that reflect current machine availability, near-term maintenance forecasts, and actual line configurations. The result is a feasibility check that is grounded in factory reality rather than planning assumptions.
The Supply Review
The supply review step — where supply-side feasibility is assessed against the demand plan — is the primary entry point for live machine availability and predictive maintenance signals. SAP IBP's constrained capacity planning module builds production plans that account for machine capacity alongside labor and tool availability, and adapts plans continuously as conditions change based on AI-generated insights. When a predictive maintenance signal indicates a high-probability failure event within the planning horizon, the supply review can reflect that risk immediately rather than discovering it as an execution failure.
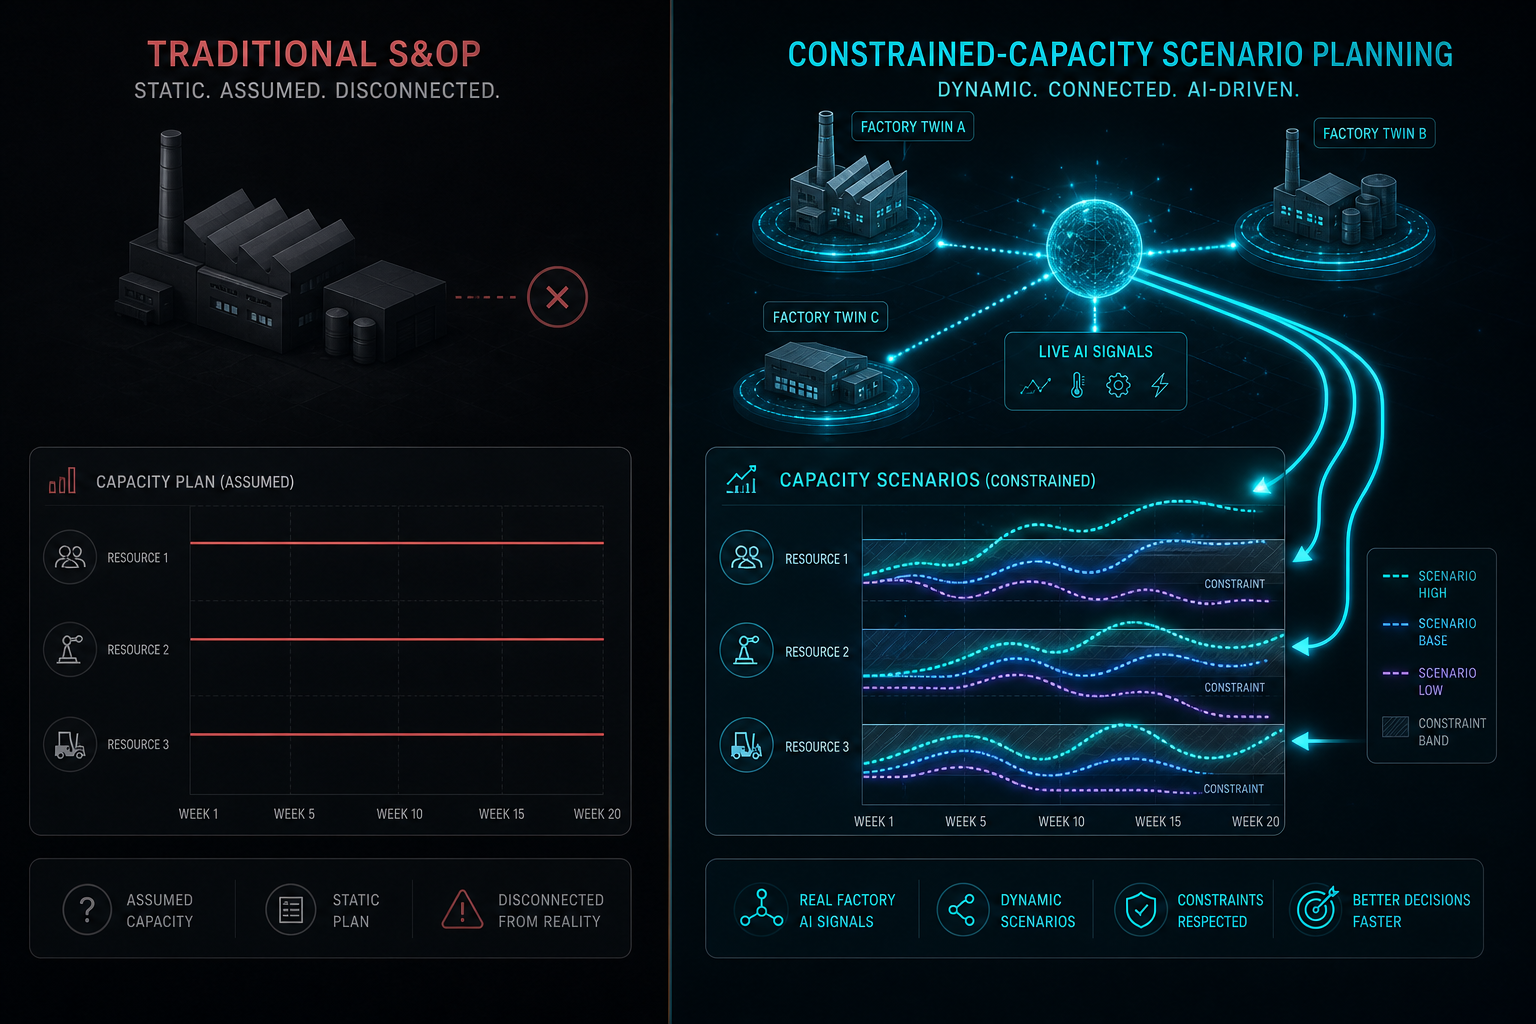
Scenario Planning
Scenario planning is where the strategic payoff of twin integration is most visible. Without live factory data, scenario planning runs what-if analyses against assumed capacity — the scenarios are only as good as the assumptions. With twin integration, scenario planning runs against actual twin-simulated factory states. Kinaxis describes digital twins of the end-to-end supply network that allow leaders to stress-test decisions before committing capital or capacity — concurrent constrained-capacity what-if runs that replace the static assumption-based scenarios that most S&OP processes still rely on.
"We used to operate like MapQuest — a static plan. Now we need to operate like Google Maps — constantly recalculating."
That framing, from a panelist at the Gartner Supply Chain Symposium in May 2026 as reported by Kinaxis, captures the planning model shift that twin integration enables. Scenario planning has moved from a periodic exercise to a daily capability at leading organizations — running multiple scenarios in parallel, evaluating financial and operational trade-offs in real time, and aligning supply chain, finance, and commercial teams faster.
Implementation Challenges and Failure Modes
Practitioners attempting this integration encounter a predictable set of failure modes. Understanding them before starting reduces the risk of building integration infrastructure that produces noise rather than planning signal.
Data Latency Accumulation
OT systems refresh in seconds or minutes. S&OP planning systems consume data in hours, days, or weeks. The integration architecture must explicitly manage the aggregation, buffering, and transformation of high-frequency OT data into planning-cadence signals. Without this, the planning system either receives data it cannot process at the rate it arrives, or receives stale aggregates that undermine the value of real-time twin data.
Multiple Versions of the Truth
When OT systems and IT planning systems maintain separate capacity models without a reconciliation mechanism, planners face conflicting capacity figures. The MES says one line is available; the APS says it is down for maintenance. The digital twin shows a constraint; the S&OP plan ignores it. Without a single-version-of-factory-truth governance model, planners default to the number they trust — and that trust is usually based on familiarity, not accuracy.
Execution Lag from System Desynchronization
The Gartner Symposium reporting identified a persistent execution gap: some systems update in real time while others lag behind, and that disconnect slows execution. This is not just a data quality problem — it is a decision quality problem. When the planning system's view of factory capacity is two days old and the factory's actual state has changed, decisions made against the plan are made against a fiction. The P&G perspective, as reported in Supply Chain Dive, frames this precisely: when supply chains appeared to break, what really failed was not just system integration, but decision integration.
Absent Bridge Ownership
The most common reason integration projects stall is not technical failure — it is that no one owns the bridge. OT teams are accountable for the twin's accuracy. Supply chain teams are accountable for S&OP quality. Neither team is accountable for the data pipeline connecting them, and neither has the cross-functional authority to enforce the governance decisions that pipeline requires. Without explicit ownership, the bridge becomes an orphaned infrastructure component that degrades over time.
Platform Landscape: Where These Integrations Are Being Built
The relevant platforms span two layers: the OT-IT bridge infrastructure that moves factory data into enterprise-accessible form, and the APS/IBP platforms that consume that data for planning. Most production integrations involve both layers.
SAP Integrated Business Planning (IBP)
SAP IBP's constrained capacity planning module builds production plans that account for machine capacity, labor, and tool availability — the planning-side endpoint for factory twin data. The platform connects demand, supply, and operations planning in a single environment and supports AI-enabled autonomous planning and scenario evaluation. SAP IBP is designed to adapt plans continuously as conditions change, which makes it architecturally compatible with live factory data feeds when the integration pipeline is in place.
Kinaxis RapidResponse
Kinaxis describes its concurrent planning model as enabling digital twins of the end-to-end supply network — the ability to stress-test decisions before committing capital or capacity. The platform's architecture moves away from sequential planning (demand, then supply, then logistics) toward concurrent evaluation where downstream implications are visible at the time a decision is made. Kinaxis also recommends building a Planning Center of Excellence as the governance structure for managing data quality, algorithm performance, and cross-functional alignment — directly addressing the ownership gap that most integration projects fail to resolve.
Siemens Xcelerator and Teamcenter
Siemens provides the process digital twin and digital thread infrastructure that sits between the factory floor and enterprise planning systems. Teamcenter manages the product lifecycle data that feeds the digital thread; Xcelerator provides the broader platform for connecting product, production, and performance twins. For manufacturers already in the Siemens ecosystem, these tools provide the semantic layer that makes factory data consumable by planning systems — translating OT telemetry into planning-relevant signals.
Azure Digital Twins
Azure Digital Twins functions as the OT-IT bridge PaaS layer: IoT Hub ingests device data from the factory floor, the twin graph models the facility, and event routing via Event Hubs, Event Grid, and Service Bus delivers state changes to downstream analytics or planning systems. Integration with Azure Synapse Analytics enables aggregation and transformation before data reaches planning platforms. This architecture is platform-agnostic at the planning end — the event routing can feed SAP IBP, Kinaxis, or other APS platforms through appropriate connectors.
o9 Solutions
o9 Solutions is an AI-native planning platform that includes digital twin connectors as part of its integrated business planning environment. Specific connector capabilities and supported OT data sources should be verified against current product documentation — this is an area of active development across all planning platforms and published capability descriptions may lag actual product state.
| Platform | Primary Role in Integration Stack | Key Capability | Integration Layer |
|---|---|---|---|
| SAP IBP | APS / Planning endpoint | Constrained capacity planning, AI-enabled autonomous planning, scenario evaluation | IT / Planning |
| Kinaxis RapidResponse | APS / Planning endpoint | Concurrent planning, supply network digital twin, Planning CoE governance model | IT / Planning |
| Siemens Xcelerator / Teamcenter | Digital thread and process twin infrastructure | Product-production-performance twin integration, digital thread semantic layer | OT-IT bridge |
| Azure Digital Twins | OT-IT bridge PaaS | IoT Hub integration, event routing to downstream analytics and planning systems | OT-IT bridge |
| o9 Solutions | APS / Planning endpoint | AI-native planning with digital twin connectors (verify current capabilities) | IT / Planning |
Phased Implementation Roadmap and Readiness Checklist
The most common implementation mistake is attempting to connect all factory twin data to the full S&OP process simultaneously. The data pipeline, governance model, and organizational alignment required for broad integration take time to establish. A phased approach reduces risk and produces early proof of value that builds organizational support for the harder governance work.
Phase 1: Prove the Pipeline on a Single Segment
Select one product line or factory segment where the twin is already producing reliable data and where the S&OP team has a clear capacity planning pain point. Build the OT-IT bridge for that segment only. Establish the data transformation from OT telemetry to planning-relevant signals (available capacity, maintenance risk horizon, constraint severity). Validate that the planning system can consume and act on those signals before expanding scope.
Phase 2: Establish Governance Before Scaling
Before expanding the integration to additional lines, plants, or S&OP steps, establish the governance model that will prevent the multiple-versions-of-truth failure mode. This means defining a single source of factory truth for each data element, assigning explicit ownership for the OT-IT bridge, and establishing a cross-functional review process for data quality issues. Kinaxis recommends formalizing this through a Planning Center of Excellence that governs data quality, algorithm performance, and cross-functional alignment. The CoE does not need to be a large organization — but it needs to exist and have authority.
Phase 3: Align Planning Cadence Before Expecting Quality Improvement
Live factory data feeding a monthly S&OP cycle produces limited improvement if the planning process cannot act on signals between cycles. Before broad rollout, align the planning cadence across functions — supply review, scenario planning, and rough-cut capacity planning — so that the organization can respond to factory state changes at the cadence the twin supports. This is a process and organizational change, not a technology change.
Readiness Checklist
Before beginning integration work, assess readiness across three dimensions:
- Data infrastructure prerequisites: Factory twin is producing reliable, validated data outputs. MES or SCADA data is accessible via API or event stream. OT network security allows controlled data egress to IT systems. Data schema for capacity signals has been defined and agreed across OT and supply chain teams.
- Organizational prerequisites: Named owner for the OT-IT bridge with cross-functional authority. Executive sponsor in both operations and supply chain functions. Agreement on a single-version-of-factory-truth governance model. Planning cadence alignment across supply review, RCCP, and scenario planning steps.
- Integration prerequisites: APS or IBP platform supports constrained capacity planning inputs. Event routing or connector architecture is designed and tested for the pilot segment. Data latency from OT refresh to planning system consumption is within acceptable bounds for the planning decisions being made. Fallback process is defined for periods when the data pipeline is unavailable.
The manufacturers who close the digital-twin-to-S&OP gap are not necessarily those with the most sophisticated technology stacks. They are the ones who resolve the governance and ownership problems that technology cannot fix — and who build the integration incrementally enough to learn from each phase before committing to the next.
Comments
Join the discussion with an anonymous comment.