
§ 41 — Use-case analysis
The Cyclospora 2025 outbreak exposes a supply chain map mismatch
The 2025-2026 Cyclospora outbreak sickened thousands across 41 states, but the recalled lettuce reached 27 states while confirmed outbreak cases concentrated in only 9. This analysis maps the geographic divergence and explains why distribution analytics could improve recall targeting.
- Function
- recall management
- AI technique
- distribution analytics
- Failure pattern
- supply chain data silos
- Evidence source
- CDC HAN Notice (July 2026)
The useful map of the Cyclospora outbreak is not one map. It is three maps that do not line up cleanly.
As of the CDC’s July 2026 materials, at least 4,173 domestically acquired cyclosporiasis cases had been confirmed across 41 states. Inside that national burden was a Taco Bell-linked traceback cluster of 1,947 illnesses in 9 states: Illinois, Indiana, Kansas, Kentucky, Michigan, Ohio, Oklahoma, Pennsylvania, and West Virginia. Separately, Taylor Farms recalled iceberg lettuce that had moved through a 27-state distribution footprint. The 2025 comparison belongs in the baseline, not the map: the current supply-chain problem is that the case map, the traceback map, and the recall map are measuring different systems on different clocks.[1][2]
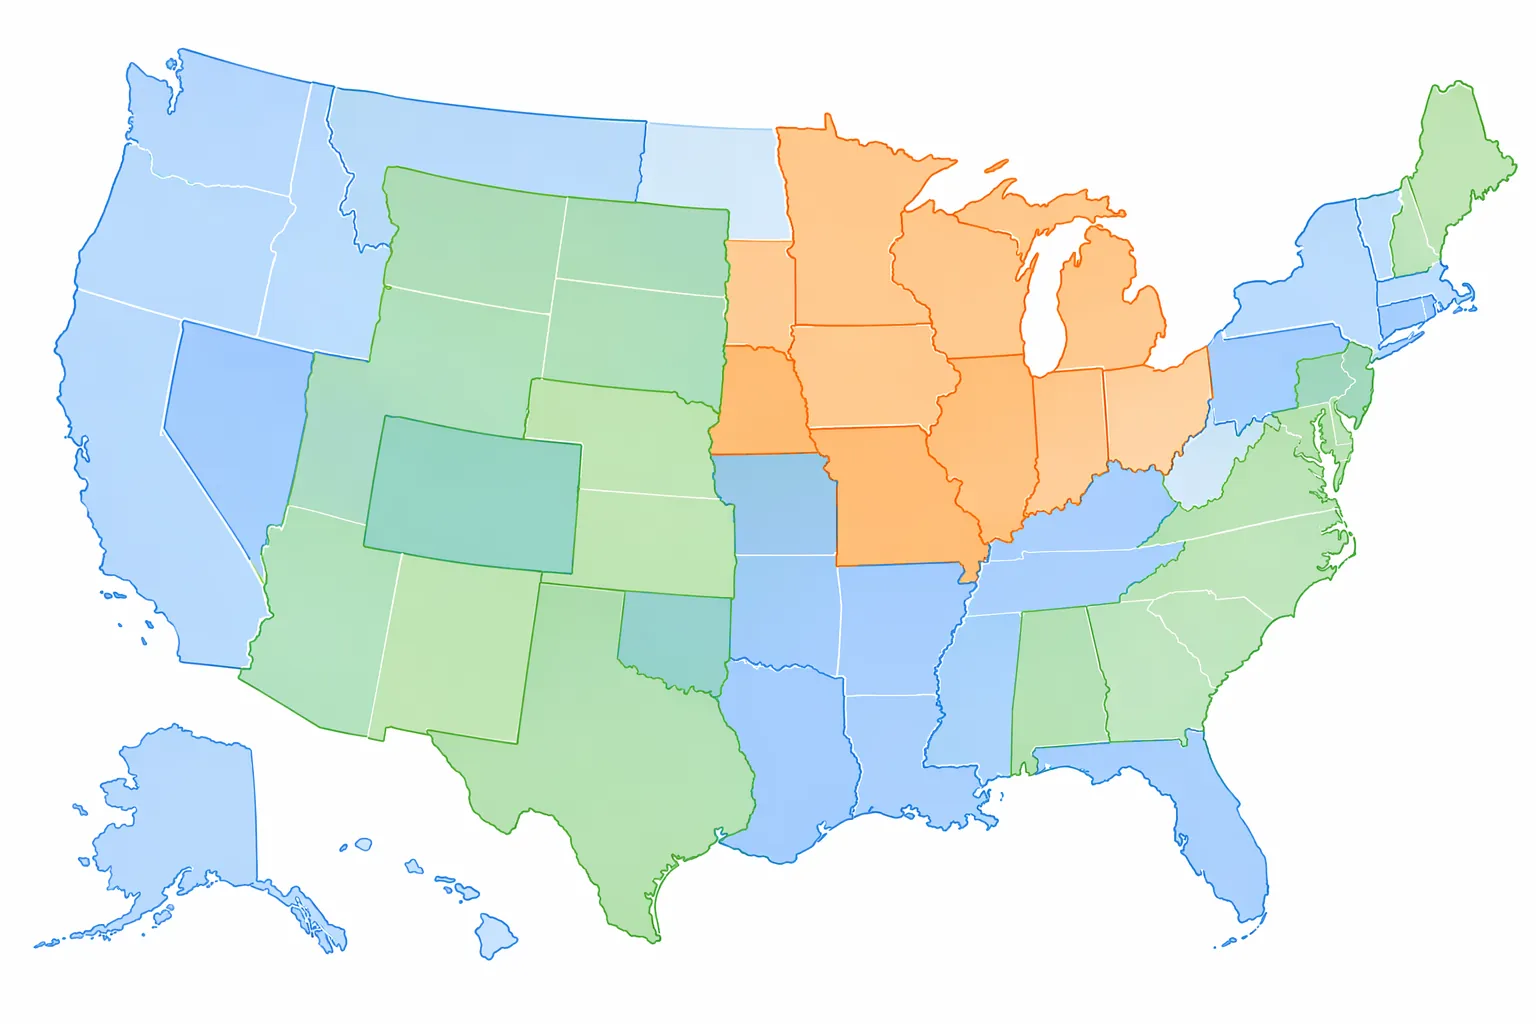
The 41-state map shows surveillance burden. The 9-state Taco Bell cluster shows confirmed epidemiological linkage. The 27-state recall footprint shows where potentially implicated product traveled. Those maps can all be true at the same time, and treating any one of them as the master map is how recall scope gets distorted.
The 27-State Recall Footprint Was Not the Same Thing as the 9-State Outbreak Footprint
The most operationally important gap is not between 41 states and 9 states. The national case count includes domestically acquired cases across many contexts, not all of which were tied to the Taco Bell traceback. The sharper comparison is the 27 states that received recalled Taylor Farms iceberg lettuce against the 9 states in the confirmed Taco Bell-linked cluster.[1][2]
| Map Layer | What It Measures | Geographic Scope in July 2026 | What It Cannot Prove Alone |
|---|---|---|---|
| National Cyclospora case map | CDC-confirmed domestically acquired cyclosporiasis cases | 4,173 cases across 41 states | That all cases came from one product, restaurant channel, or supplier |
| Taco Bell-linked traceback cluster | Illnesses with confirmed epidemiological linkage to the investigated restaurant cluster | 1,947 illnesses across 9 states | That exposure did not occur in other distribution states |
| Taylor Farms recall distribution footprint | States that received recalled iceberg lettuce | 27 states | That every receiving state had confirmed illnesses or that the product sample proved causation |
All 9 confirmed Taco Bell-linked states sat inside the recall geography described in the public materials. That overlap matters because it keeps the lettuce traceback operationally plausible. But the larger recall footprint also means most receiving states were not, at that point, part of the confirmed Taco Bell-linked illness cluster. In recall terms, that is not noise. It is the uncomfortable middle zone between exposure possibility and confirmed outbreak attribution.
A broad recall can be the right decision when product has already moved through multi-state channels. It can also consume inventory, labor, inspection time, customer communications, and public-health attention in places where no linked illnesses have yet been confirmed. A narrow recall has the opposite failure mode: it can look efficient on a confirmed-case map while missing markets where product arrived before illness reports matured.
That is why the expansion of the Taco Bell-linked cluster from 5 states to 9 states in one week is more than a case-count update. It shows that the outbreak-confirmed geography was still moving after the supply-chain geography had already been drawn. A receiving state that was outside the confirmed cluster on one update could move inside it on the next, not because lettuce suddenly traveled there, but because interviews, lab confirmation, and case classification caught up.[1]
The ingredient-level signal also came through interviews, not through a clean product-test storyline. Michigan health officials found that 90% of 190 interviewed cases reported eating iceberg lettuce at Taco Bell, which helped support the traceback focus. That is a strong operational lead, but it is not the same as saying every illness, every state with cases, or every distribution lane was explained by that one path.[3]
Distribution States Without Confirmed Taco Bell-Linked Cases Sit in the Hardest Category
The distribution-but-not-confirmed states are where the map becomes operational rather than journalistic. They can mean at least three different things, and the same state can move between interpretations as the investigation changes.
- Under-detection: illnesses may have occurred but not yet been tested, reported, interviewed, linked to Taco Bell, or confirmed by CDC.
- Different exposure paths: some Cyclospora cases may have come from other products, restaurants, retailers, or contamination vectors rather than the Taco Bell-linked lettuce pathway.
- Supply-chain lead time: product movement can be known before epidemiological linkage is complete, especially when cases emerge after an incubation period.
None of those explanations should be treated as a settled answer as of July 25, 2026. The distribution footprint is not proof of causation. The confirmed cluster is not proof that other receiving states had no exposure. The national case map is not proof that all 41 states belong to the same traceback event.
That distinction matters because the Taylor Farms network was not a single-store geography problem. Public reporting tied the recalled iceberg lettuce distribution to channels that included Walmart, Taco Bell, Sysco, US Foods, and Jack in the Box. Those names do not all perform the same role in a supply chain. They point to a product moving across retail, restaurant, and foodservice distribution routes, which means exposure geography can be wider than the restaurant cluster that first produces a clear epidemiological signal.[2]
This is also where the false-positive sample retraction belongs: visible, but not inflated. FDA announced a positive product sample on July 18 and retracted it as a false positive on July 19. That retraction does not erase the interview and traceback work, but it does remove a tempting shortcut. The product-testing narrative cannot carry more certainty than the investigation actually supports.[2]
The Timing Mismatch Is as Important as the Geography
Shipment geography is usually available on a faster clock than confirmed illness geography. Product moves in hours or days. Cyclospora symptoms typically appear after a 1- to 2-week incubation period. CDC confirmation can lag state signals by roughly 6 weeks because cases have to move through testing, reporting, interviews, and classification.[3]
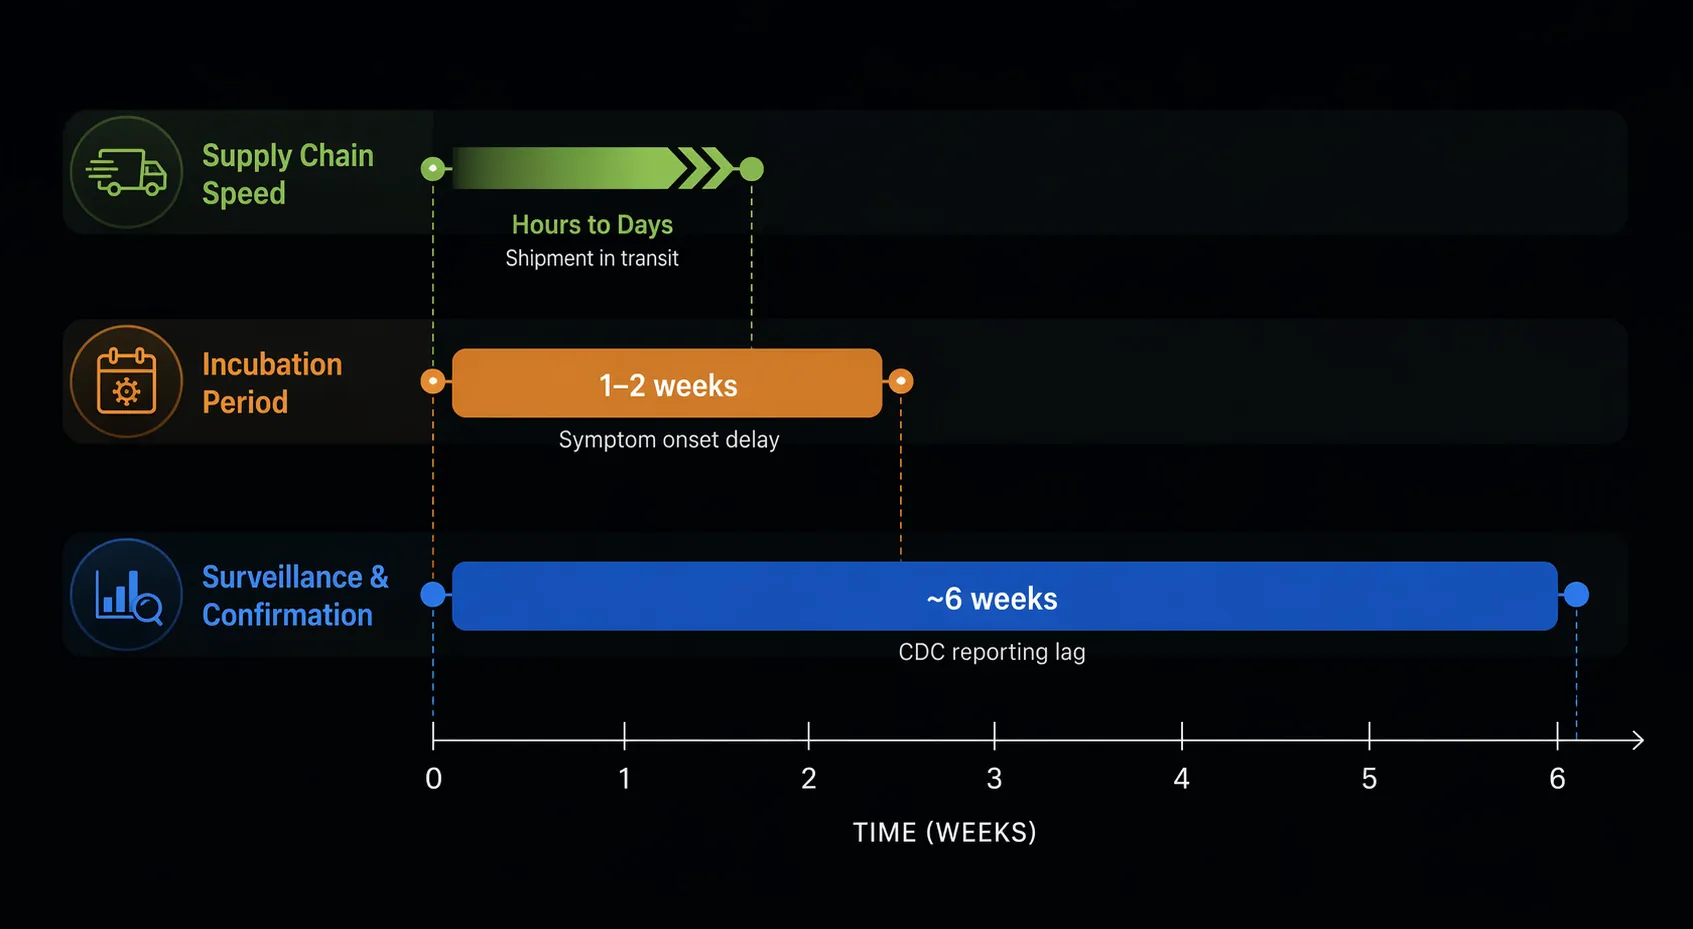
Michigan showed how extreme that timing gap can look when state data and CDC-confirmed national data are placed side by side without their definitions attached. State-level reporting cited 4,312 Michigan cases, far above the state’s typical annual average of 40 to 50. Ohio reported 1,274; New York about 394; Illinois 277; North Carolina 240; Indiana 206; Colorado 150; Kentucky about 100; West Virginia 69; and Texas 48. Those state figures were not identical to CDC-confirmed national figures because they were moving through different reporting and confirmation stages.[4]
CIDRAP highlighted the same problem from the other side: Michigan had reported 4,312 cases while CDC was reporting only about 1,645 confirmed nationally as of July 14. That is not a small rounding issue. It is a warning that a confirmed national map can be behind the operational reality that state health departments and recall teams are already seeing.[3]
This lag changes what “states affected” means. A state can be affected because people are sick there. It can be affected because product arrived there. It can be affected because a distributor, customer, or restaurant operator has to pull product before illness linkage is complete. Those are different obligations, and the same shaded state on a public map does not tell a planner which obligation applies.
Scale Supports Seriousness, but It Does Not Resolve the Map
The national numbers were large by any reasonable food-safety standard. CDC reported ages ranging from 2 to 95, a median age of 44, 56% female cases, 308 hospitalizations, and no deaths. The same-date comparison in 2025 was 249 cases, making the July 2026 count roughly a 16-fold increase.[1]
Those numbers establish seriousness. They do not, by themselves, solve the distribution question. A record-setting national case count can coexist with a narrower confirmed traceback cluster, a wider recall footprint, and unresolved contamination pathways. Conflating those layers would make the outbreak look simpler than it was.
What Better Recall Targeting Would Have to Compare
The technology lesson comes late because it only makes sense after the mismatch is visible. Traceability tools and distribution analytics are not valuable because they create cleaner diagrams. They are valuable if they let decision-makers compare exposure footprint against confirmed-case footprint while both are still changing.
In this outbreak, a useful recall-management view would not start with a generic national heat map. It would layer shipment destinations, customer-channel distribution, lot and date information, restaurant or retailer exposure paths, state case signals, CDC-confirmed links, and reporting lag. The hard question is not “Which states are shaded?” It is “Which states received relevant product, through which channel, during which window, and how far behind are illness confirmations likely to be?”
That is the practical bridge to distribution analytics, including the kind of recall containment logic discussed in ChainSignal’s AI recall management analysis. The useful capability is not replacing investigators. It is giving recall coordinators a working comparison of where product could have gone, where illness has already been linked, and where surveillance lag makes absence of evidence especially weak.
The International Fresh Produce Association’s response fits here. IFPA called for stronger implementation of the FDA Food Traceability Rule and end-to-end supply-chain traceability in response to the outbreak. That call is reasonable, but only if traceability is understood as an integration problem rather than a compliance label. Shipment data, customer data, public-health data, and investigation status have to meet in the same operating view before they can improve recall scope.[5]
Better tools would not have made the July 2026 investigation instant or certain. They cannot manufacture a confirmed source, fix a false-positive sample, or eliminate the need for interviews and lab confirmation. They can, however, reduce the time spent arguing from incompatible maps.
The Operational Lesson as of July 25, 2026
As of July 25, 2026, the Cyclospora outbreak exposed a supply-chain map mismatch more than it proved a single clean geography. The recalled Taylor Farms lettuce reached 27 states. The confirmed Taco Bell-linked cluster sat in 9 states. CDC-confirmed domestically acquired cases reached 41 states. Those are not competing versions of the event; they are different layers of it.
Recall effectiveness depends on integrating shipment geography, customer-channel distribution, epidemiological linkage, and surveillance lag instead of letting each map sit in its own system. That judgment may change if updated case counts, revised distribution states, or a confirmed source narrows or widens the contamination pathway. Until then, the safest reading is precise rather than dramatic: the outbreak shows how quickly product geography can outrun confirmed illness geography, and how costly it is when recall teams have to reconcile those maps after the fact.
References
- CDC HAN Notice and Investigation Update, Centers for Disease Control and Prevention, July 2026.
- FDA Investigation and Recall Materials on Taylor Farms Iceberg Lettuce, U.S. Food and Drug Administration, July 2026.
- US Cyclospora Cases Mount as CDC Lags on Tracking, CIDRAP, July 2026.
- State Health Department Cyclospora Case Reporting, TODAY.com, July 2026.
- IFPA Calls for Stronger Food Traceability Rule Implementation, The Shelby Report, July 2026.
§ 42 — Cited evidence
Flag an inaccuracy or submit a comparable account — Contribute or read how claims are verified in Methodology.