
§ 41 — Use-case analysis
The Real Bottleneck in Wildfire Risk AI for Supply Chains
AI-powered burn area mapping detects wildfires in under 15 minutes, but integrating that data into supply-chain impact models is still custom work. This article analyzes the gap and what it means for planning teams evaluating wildfire risk AI modules.
- Function
- supply-chain risk assessment
- AI technique
- computer-vision
- Failure pattern
- productization gap
- Evidence source
- Dataintelo (2026), Ma et al. (2022), Local News Matters (2026)
The awkward moment in a wildfire AI demo is rarely the detection screen. A thermal anomaly appears, a perimeter is drawn, and an alert reaches the operator fast enough to matter. Dataintelo’s 2026 market report says AI-powered burn area detection can move from satellite thermal anomaly to perimeter alert in under 15 minutes, versus 60 to 90 minutes for legacy observation networks, citing Technosylva and OroraTech deployments.[1] That is a real operational gain.
The harder question starts after the perimeter exists. Which suppliers sit inside or near that polygon? Which lanes pass through the threat area? Which inventory positions are now covering a facility with higher interruption probability? Which customer commitments are exposed if the nearest alternate route adds cost or time? A burn area alert is not yet a supply-chain impact analysis. It is an upstream signal waiting to be translated into the planning model.
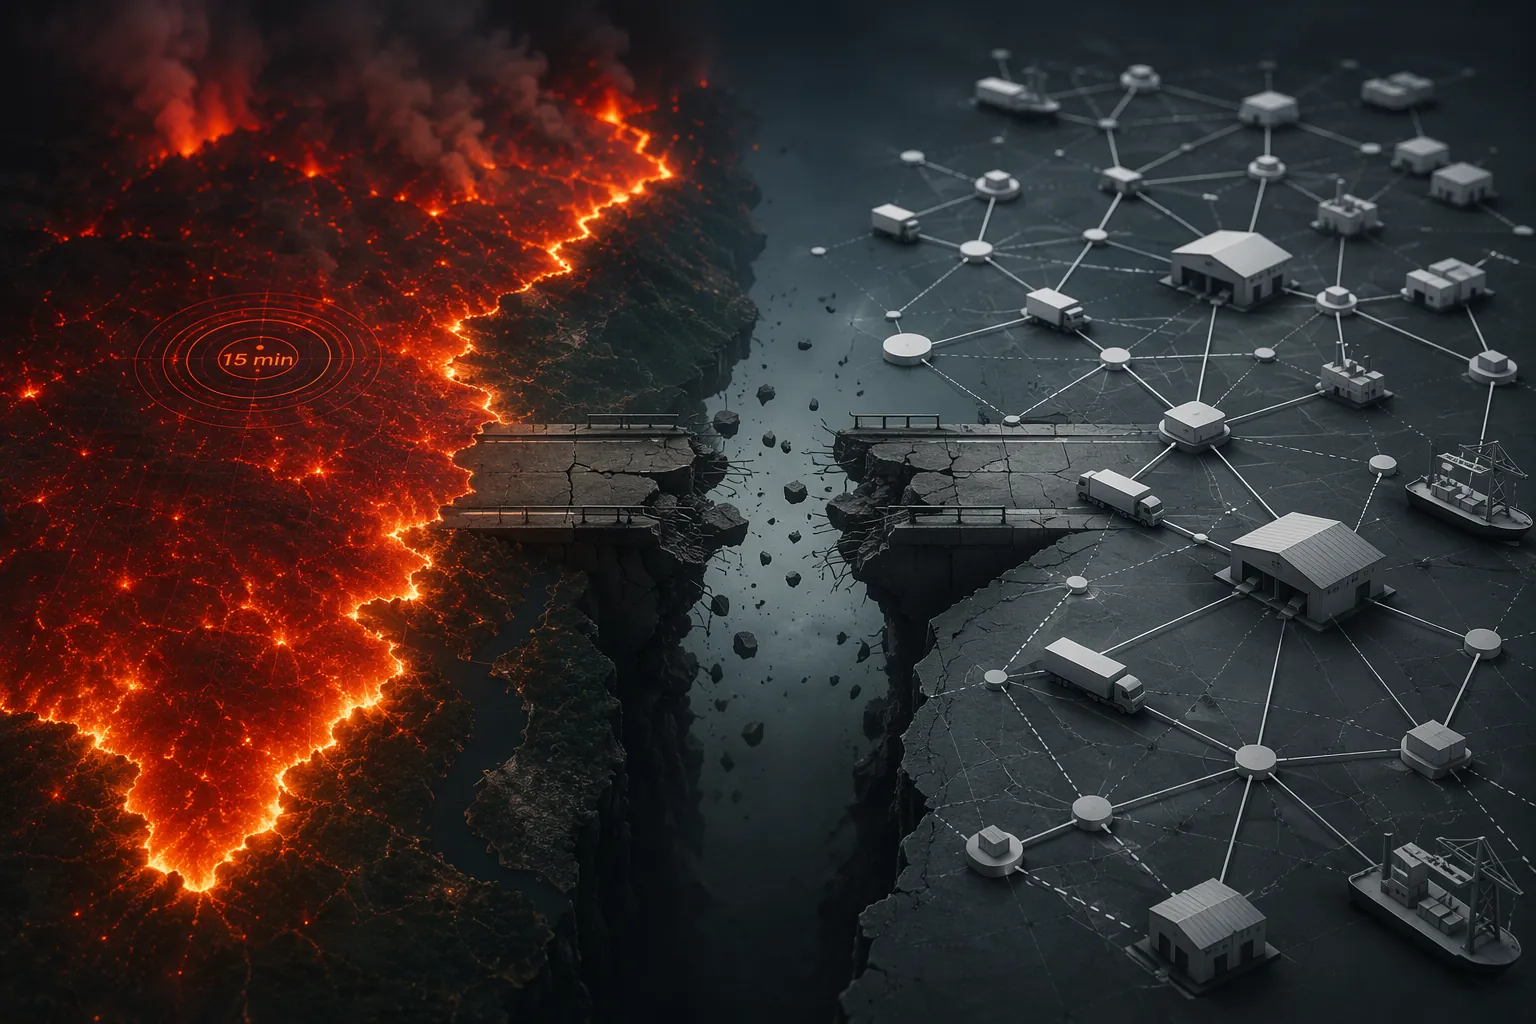
That distinction matters for teams evaluating AI for wildfire burn area supply-chain impact analysis in 2026. The sensing layer is moving quickly. The planning layer is not just another visualization problem. It requires a structured conversion from hazard geography into node, lane, inventory, service, and cost consequences.
Detection Latency Is Not Decision Latency
The wildfire AI market is large enough now that supply-chain buyers will keep seeing it in risk, resilience, and control-tower conversations. Dataintelo estimates the wildfire risk AI platform market reached $2.8 billion in 2025 and projects it at $9.4 billion by 2034, a 14.2% CAGR.[1] The same report says commercial satellite imaging costs fell 40% to 50% over three years, lowering the barrier to daily, high-resolution burn area data that was previously harder for non-government buyers to access.[1]
Those figures are useful context, not proof that supply-chain planning workflows have been solved. The buyer mix tells the more important story. Dataintelo attributes 34.2% of market revenue to government customers and 28.6% to insurance customers.[1] That leaves supply-chain-specific use as a less mature slice of the market, even if the same wildfire intelligence could clearly matter to manufacturers, retailers, distributors, and logistics providers.
A planning director does not need to be convinced that faster detection is better than slower detection. The evaluation problem is whether that faster alert reduces decision latency inside the planning stack. If a GIS analyst still exports a perimeter, overlays it against facility addresses, checks carrier lanes manually, and sends a spreadsheet to the supply-planning team, the enterprise has bought better sensing without buying an operational supply-chain model.
The Missing Object Between a Fire Perimeter and a Planning Action
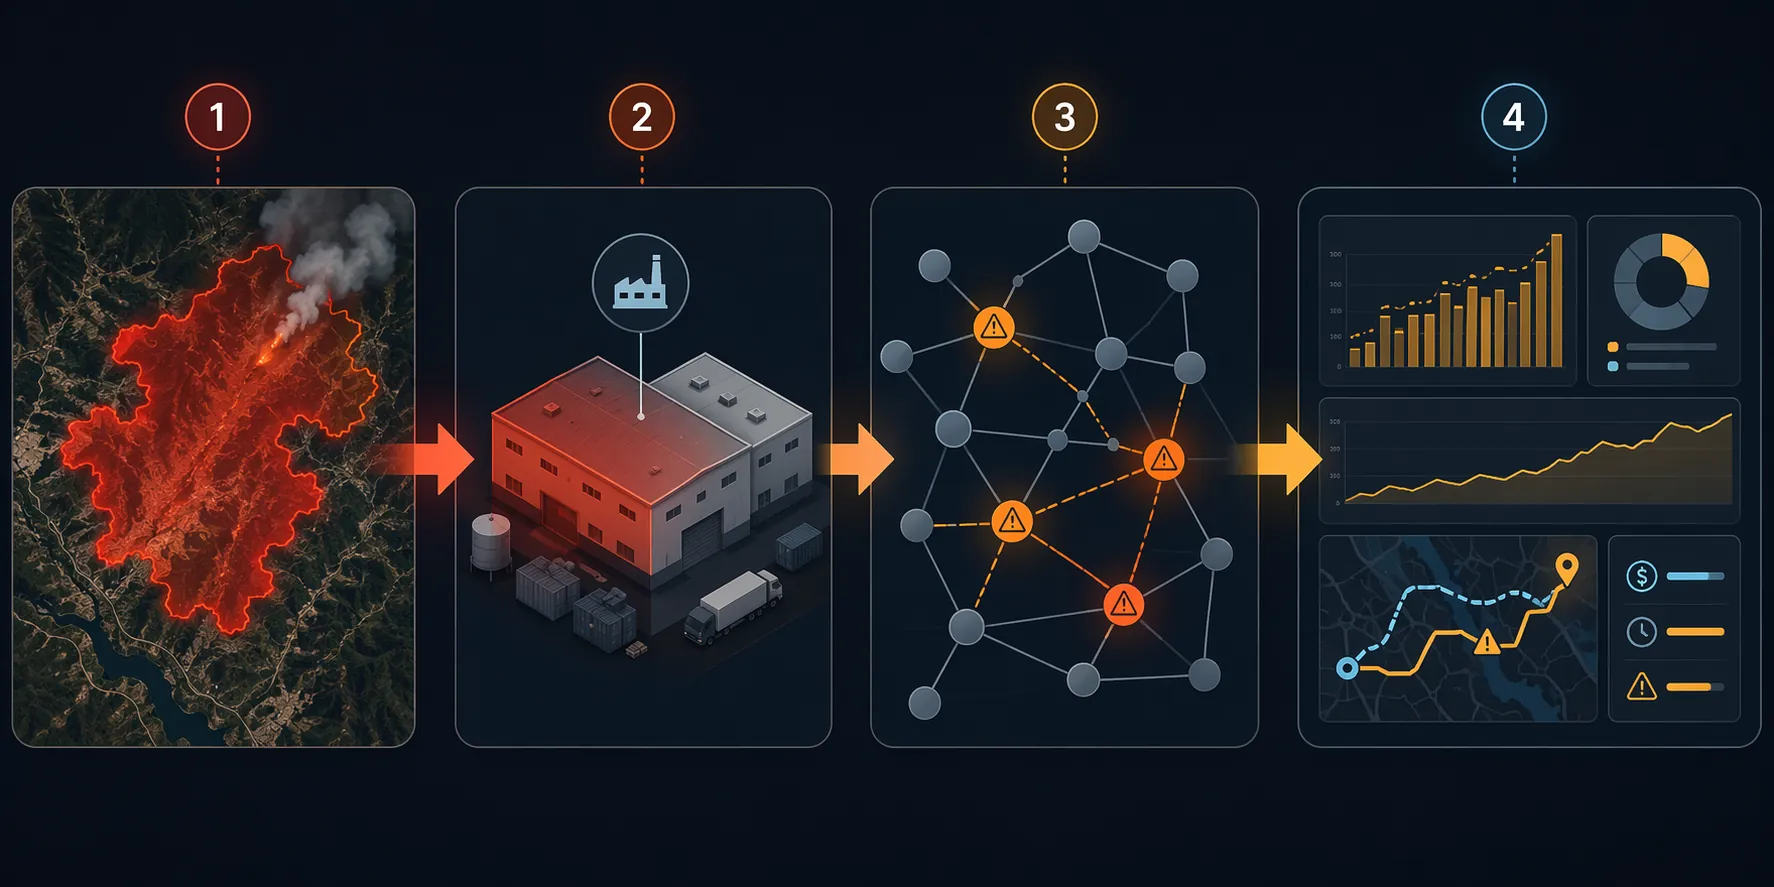
In a clean implementation, the AI model does not merely draw a fire. It creates an object the planning environment can understand: a time-stamped hazard perimeter with location, confidence, update cadence, severity attributes, and enough metadata to be joined to enterprise master data. That object then has to land somewhere: a risk platform, a middleware layer, a data lake, a control tower, or a planning suite API.
The next joins are the uncomfortable ones. Facility master data may have postal addresses but not clean latitude and longitude. Supplier sites may be known only at the corporate level, while the actual production site is a different location. Lanes may exist as origin-destination pairs without route geometry. Inventory may be visible by distribution center but not by risk exposure. Alternate sourcing rules may exist in procurement documents, not in the planning optimizer.
This is why “integration” is too soft a word. A wildfire perimeter must be converted into a planning-relevant vulnerability state. A supply-chain suite cannot decide whether to reallocate inventory, expedite freight, switch suppliers, or warn customers unless the hazard is mapped onto constrained nodes and lanes with probabilities, capacities, lead times, and costs.
The Closest Formal Workflow Is Still Academic
Ma et al. provide the closest available formal method for the missing translation layer. Their 2022 paper proposes a probabilistic wildfire risk assessment methodology for a supply-chain network, linking wildfire ignition and growth to component damage probability and then to network-level cost effects.[2] The test case is important to read carefully: it is a hypothetical sustainable aviation fuel supply chain in the Pacific Northwest, not an observed enterprise deployment.[2]
Even with that limitation, the structure is exactly the kind of handoff commercial tools need to make. The paper does not stop at “fire near asset.” It asks how wildfire behavior changes the probability that a component is damaged, how component damage affects supply-chain operation, and how the resulting disruption appears as unmet-demand penalties and detour costs.[2]
| Translation stage | Planning meaning |
|---|---|
| Fire perimeter or ignition/growth scenario | The upstream hazard signal, with location and time characteristics that can be mapped against assets. |
| Component damage probability | The chance that a facility, supplier site, route segment, or other network element is impaired. |
| Network disruption probability | The probability that damage to one or more components changes feasible flow through the network. |
| Cost and service impact | The downstream consequences, including unmet-demand penalties and detour costs. |
The non-linear behavior is the part supply-chain teams should care about. In the Ma et al. framework, wildfire-induced feedstock loss as small as a 0.1% annual reduction can still drive significant total supply-chain cost increases because the network absorbs the disruption through unmet-demand penalties and forced detours.[2] That is not a general claim that every wildfire exposure produces large cost increases. It is a modeled result from a specific hypothetical network. But it shows why simple proximity alerts are weak decision aids: small physical losses can become larger planning losses when the network has tight constraints.
A commercial implementation would need to reproduce this logic against the buyer’s own network. The model would need to know which components exist, how they connect, which flows can be rerouted, which substitutions are allowed, where demand cannot be met, and how cost penalties are calculated. A satellite-derived burn area polygon is only the first input to that chain.
Utility Operations Prove Scale, Not Supply-Chain Readiness
PG&E is a useful proof point for operational wildfire AI, but it should not be overextended. Local News Matters reported in June 2026 that PG&E uses artificial intelligence to weigh elevated fire risk.[3] PG&E’s own 2024 Corporate Sustainability Report cites a self-reported 75% reduction in CPUC-reportable ignitions in high-fire-threat areas versus 2017, and an expectation of more than 100 high-fire-danger days annually for 5 million customers. Because those performance figures are company-reported, they are best treated as evidence of deployed utility risk operations, not as independently audited proof of general AI effectiveness.
The distinction is practical. A utility can use wildfire analytics to inspect assets, manage grid risk, prioritize field work, and adjust operating procedures. A commercial supply-chain team has a different action space: it may need to qualify alternate suppliers, shift production, build or release inventory, change transportation plans, or communicate service risk to customers. The same hazard intelligence can support both environments, but the downstream model is not the same.
That is where demos often skip a layer. They show the fire intelligence and then show an enterprise decision as if the mapping were automatic. In a utility environment, the asset network and operating controls may already be deeply tied to geospatial risk. In a supply-chain planning suite, the relevant objects may live across ERP, transportation management, supplier management, demand planning, and external GIS systems.
What Buyers Should Verify Before Calling It Integrated
The evaluation consequence is straightforward: purchasing AI burn area detection is not the same as purchasing supply-chain impact analysis. In 2026, planning teams should separate the sensing capability from the translation capability during vendor review, especially when the proposed architecture touches o9, Blue Yonder, Kinaxis, RELEX, Anaplan, or adjacent planning environments.
The first question is what the wildfire module actually outputs. A map tile, PDF alert, or dashboard layer may be useful for situational awareness, but it is not enough for planning automation. The buyer should ask whether the module creates structured hazard objects with identifiers, timestamps, geometry, confidence fields, and update history that can be consumed by another system.
The second question is whether the tool can ingest the buyer’s supply-chain master data, not just display it. Facility locations, supplier sites, ports, warehouses, store networks, and transportation lanes need to be joined to the hazard layer. If lane geometry is missing, the integration has to explain whether it approximates route exposure, calls an external routing service, or leaves the work to an analyst.
The third question is whether impact is probabilistic or merely binary. “Inside perimeter” and “outside perimeter” may be acceptable for a first alert, but planning decisions often need graded exposure: damage probability, disruption probability, expected delay, expected cost increase, and confidence range. The Ma et al. framework is valuable here because it models risk as a chain of probabilities and costs rather than a red shape on a map.[2]
The fourth question is where the result appears. If the output is not visible inside the planning workflow, someone still has to carry it there. A useful integration should create or update planning-relevant records: constrained supply, lane risk, alternate route candidates, inventory exposure, unmet-demand scenarios, or cost-to-serve changes. A control-tower alert can be valuable, but it should not be mistaken for a planning-model update.
The fifth question is who owns the translation logic. Native integration means the planning suite understands the hazard object and maps it to network constraints without bespoke work. API-based middleware means a separate layer performs the joins and transformations. Manual overlay means analysts reconcile GIS, ERP, and planning data outside the system. These are not cosmetic differences; they determine implementation cost, update frequency, auditability, and who gets blamed when the alert arrives but the plan does not change.
A Short Evaluation Script
- Show the exact data object created when a new burn perimeter is detected.
- Show how that object joins to facility, supplier, and lane master data.
- Show whether the model calculates damage probability, disruption probability, or only proximity.
- Show the planning-screen consequence: constrained supply, reroute option, inventory action, service-risk alert, or cost scenario.
- Show which parts are native, which parts require middleware, and which parts still rely on analyst overlay.
This script is deliberately operational. It avoids the easier discussion about whether wildfire AI is exciting and goes straight to whether a planning team can run it without inventing the middle layer after procurement.
The Bottleneck Is Productization
Current evidence supports a narrow conclusion. AI-powered burn area mapping is mature enough to be a credible upstream feed for supply-chain risk workflows. The broader machine-learning literature describes wildfire prediction and assessment as a multi-stage pipeline, with data acquisition, modeling, evaluation, and deployment challenges rather than a single model-output event.[4] Disaster-management commentary makes a similar point from another angle: AI damage assessment can improve response, but data quality, coordination, and operational adoption remain central challenges.[5]
What the available materials do not show is a productized, off-the-shelf conversion from AI fire perimeter data into supply-chain network vulnerability inside major planning suites. The formal methodology exists in academic form. Utility operations show that wildfire AI can be deployed at scale. Market data shows that the sensing and risk-intelligence ecosystem is expanding. None of that proves that a manufacturer or retailer can buy a wildfire module today and automatically receive probabilistic node and lane impact inside its planning model.
That is the practical judgment for supply-chain buyers. Fast burn area detection can feed planning systems, and the economics of satellite data make that feed more accessible than it used to be. The operational value still depends on custom translation work between hazard intelligence and network models: the joins, probabilities, constraints, and cost logic that turn a fire perimeter into a planning decision.
References
- Wildfire Risk AI Platform Market Research Report 2033 — Dataintelo, May 2026.
- Probabilistic Wildfire risk assessment methodology and evaluation of a supply chain network — ScienceDirect, 2022.
- PG&E uses artificial intelligence to weigh elevated fire risk — Local News Matters, June 2026.
- A comprehensive survey of the machine learning pipeline for wildfire risk prediction and assessment — Ecological Informatics, 2025.
- Transforming Disaster Management: The Promise and Challenges of AI in Wildfire Damage Assessment — NCDP Columbia.
§ 42 — Cited evidence
Flag an inaccuracy or submit a comparable account — Contribute or read how claims are verified in Methodology.