
§ 41 — Use-case analysis
Which Supply Chain Platform Handles Storm Disruptions Best?
A capabilities comparison of five supply-chain planning platforms for storm-driven air freight disruption, benchmarked against real disruption data from Hurricane Ian, Winter Storm Izzy, and 2025 air cargo performance declines.
- Function
- disruption planning
- AI technique
- optimization
- Failure pattern
- weather-to-planning integration gap
- Evidence source
- CargoAi 2025, Spire Global Izzy, Everstream Ian
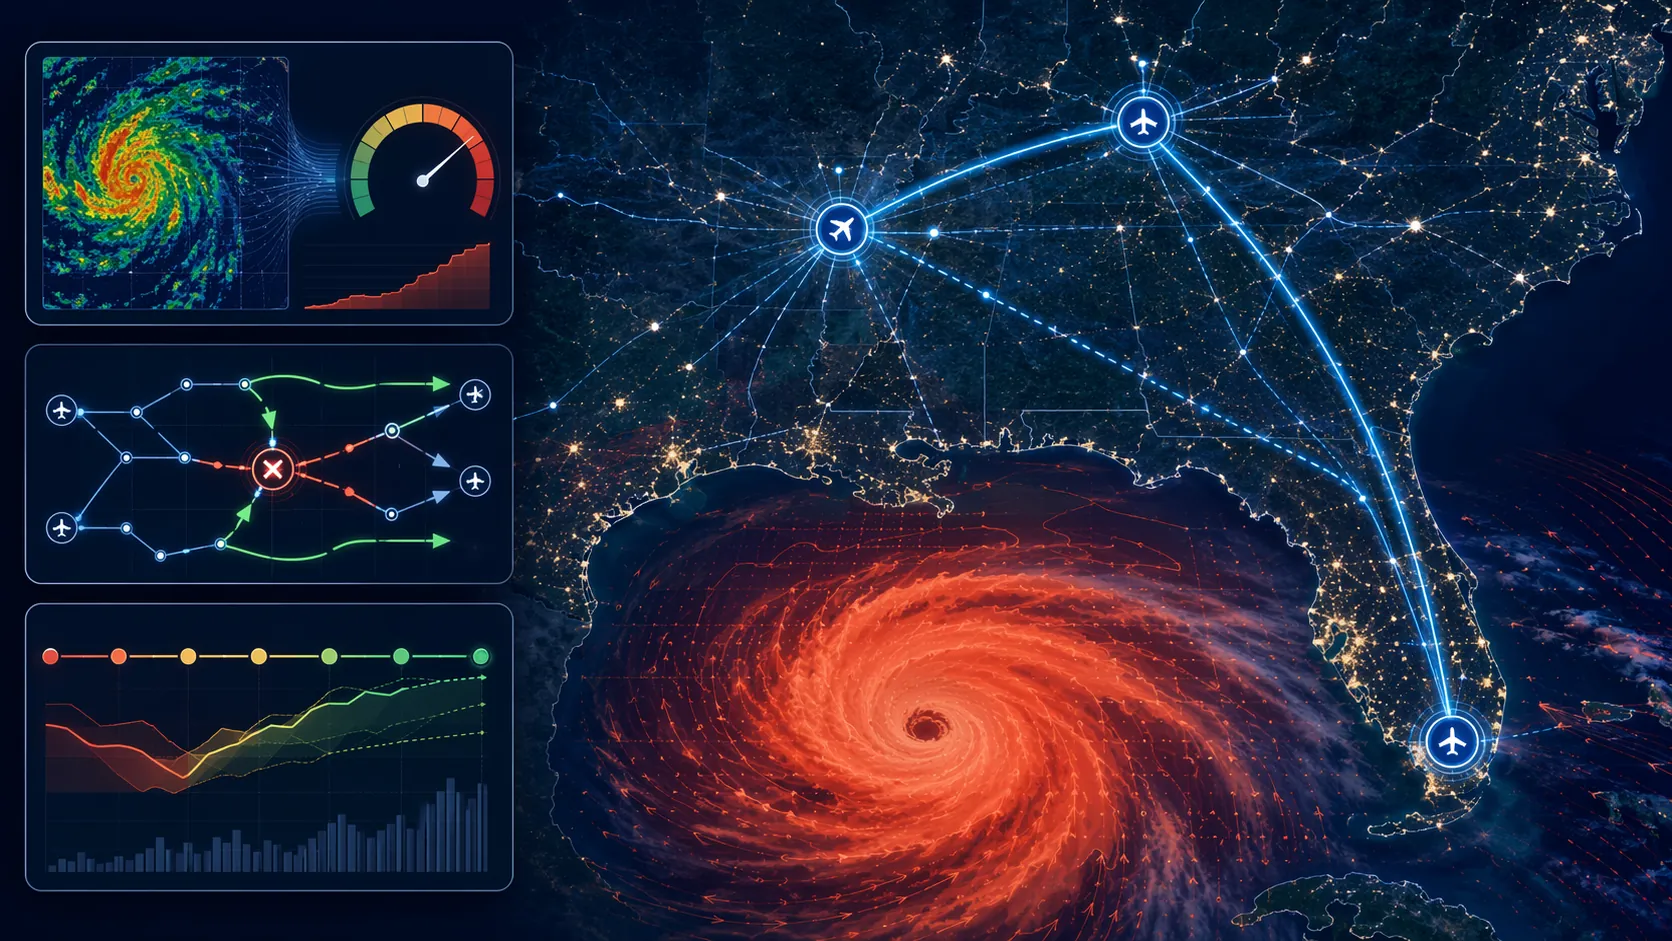
Put a Category 3 hurricane on a track toward a major Gulf-linked air-freight hub and the platform demo gets very simple. The useful question is not whether a control tower can paint the storm cell on a map. It is whether the planning system changes the shipment plan early enough: which lanes move from watchlist to probable failure, which hub capacity gets pulled forward or shifted, and how many days of recovery time the promise-date model absorbs before customer windows become fiction.
That is the practical test behind planning for storm delays and air-freight logistics disruption. A platform that only displays external weather risk still leaves the hardest work with planners, brokers, and expeditors. A platform that turns weather into lane-level probabilities, alternate routings, constrained capacity allocation, and multi-day recovery scenarios is doing something operationally different.
The Disruption Baseline Is Already Severe Enough
Air cargo reliability weakened before any platform comparison begins. CargoAi’s 2025 delivery-as-planned score fell to 62.7%, according to Air Cargo News coverage published in January 2026.[1] That figure should not be treated as a weather-only number. The same reporting tied the decline to multiple pressures, including trade-policy reshuffling and ground-handling bottlenecks, so it is best used as a reliability-pressure indicator rather than storm-specific proof.
Named storm evidence gives the sharper benchmark. During Winter Storm Izzy in January 2022, Spire Global’s flight-track analysis found a 30% decline in aircraft utilization at affected hubs, while UPS and Atlas Air operations at Memphis fell by nearly half.[2] That is not a minor delay parameter. It is a capacity shock at the node level.
Hurricane Ian gives a different but equally useful calibration point. Everstream Analytics reported a 75% drop in shipments and a 2.5-day extension in shipping times around the September 2022 storm.[3] For planning software, that means the test is not only rerouting around a blocked airport. It is also whether customer commits, inventory positioning, alternate capacity, and recovery timing are recalculated across several days.
There is broader climate and infrastructure cost context, but it should stay in its lane. EDF and RTI estimated storm-related disruptions could cost maritime shipping and ports $7.5 billion per year, a useful reminder that infrastructure disruption is expensive but not a direct air-freight platform-performance measure.[4]
| Benchmark | What It Measures | Planning Implication |
|---|---|---|
| CargoAi 2025 DAP score: 62.7%[1] | All-cause air cargo delivery-as-planned performance | Use as reliability pressure, not weather-only evidence |
| Winter Storm Izzy: 30% aircraft-utilization decline at affected hubs[2] | Named-storm hub capacity effect | Model hub-level capacity collapse, not just lane delay |
| Memphis UPS/Atlas Air operations fell nearly half during Izzy[2] | Carrier and hub operating reduction | Test carrier-specific capacity substitution |
| Hurricane Ian: 75% shipment drop and 2.5-day shipping-time extension[3] | Named-storm shipment and transit-time effect | Model multi-day recovery and customer-window drift |
The Three Questions That Separate Planning From Weather Display
A fair comparison of o9, Blue Yonder, Kinaxis, RELEX, and Anaplan has to use the same operational filters for each platform. Otherwise, the exercise turns into a vocabulary contest around AI, resilience, orchestration, and control towers. ChainSignal’s broader platform-comparison approach, including Blue Yonder vs. Kinaxis, is useful here because storm response has to be reduced to comparable planning behavior.
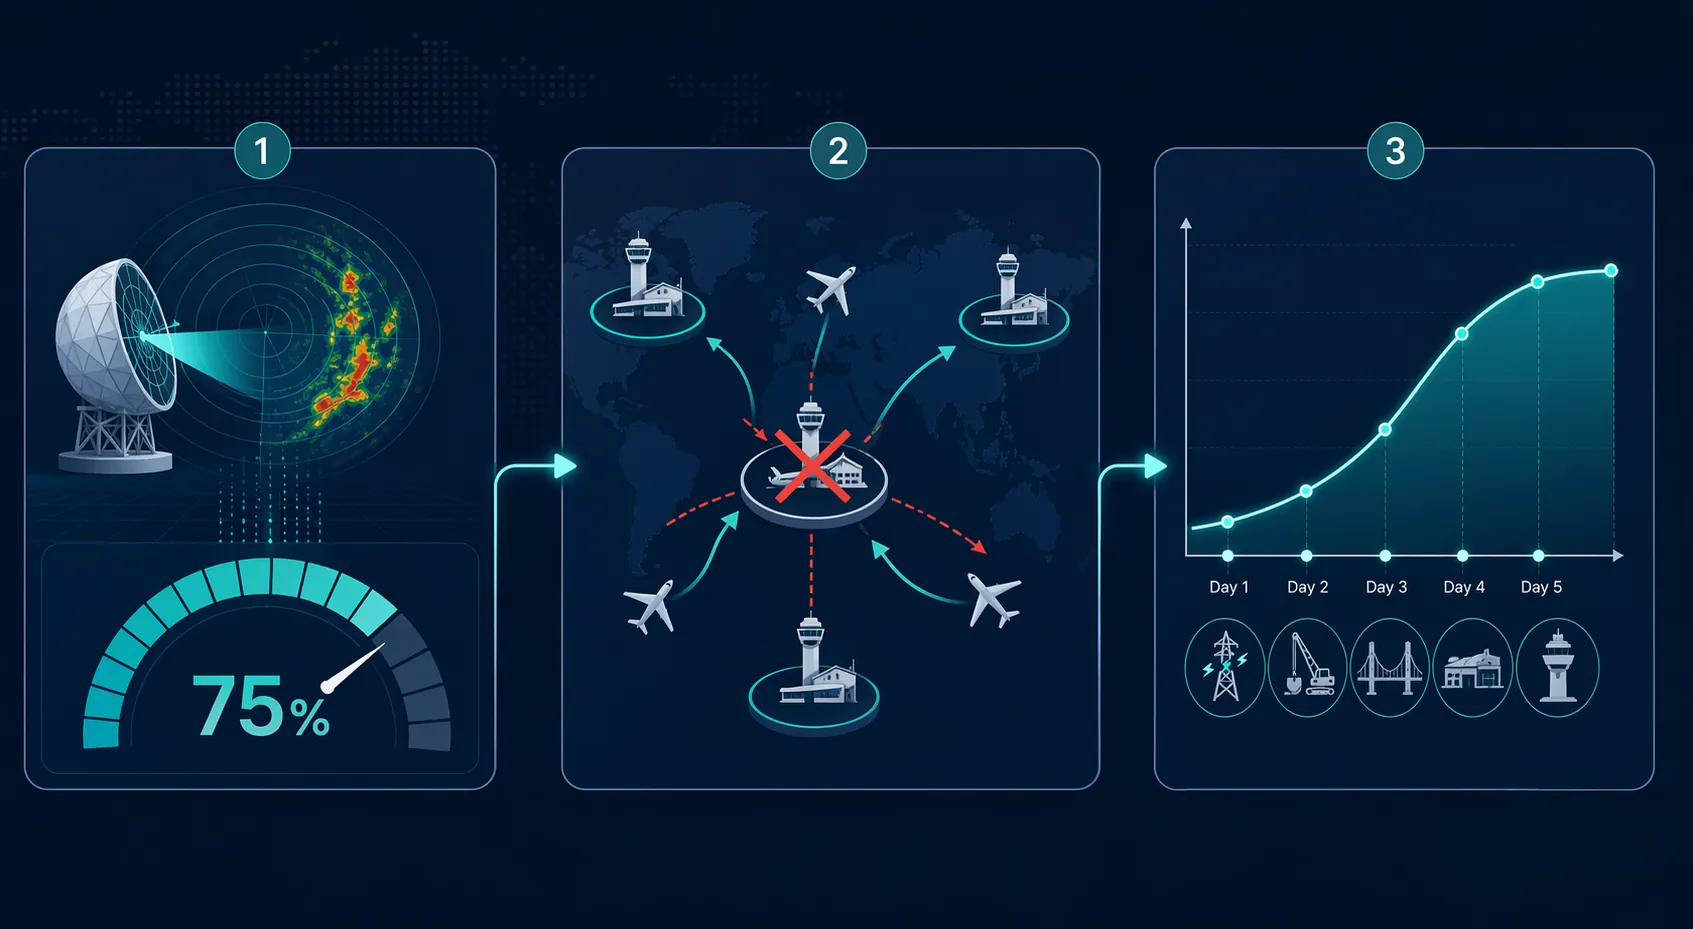
1. Weather Intelligence Must Become Lane-Level Disruption Probability
The first capability is not weather ingestion by itself. A weather API can tell a system that a storm is approaching. The planning value appears only when that signal is converted into probabilities against lanes, hubs, carrier services, and promised arrival windows.
For an air-freight-heavy shipper, this means the platform should distinguish at least three states: a lane that is exposed but still feasible, a hub that is likely to lose throughput, and a customer promise that is now structurally at risk. If all three appear as the same red alert, planners still have to build the decision logic outside the platform.
2. A Hub Outage Must Reallocate Routes and Capacity
Winter Storm Izzy is the right stress test for this filter because the published evidence is hub-operational, not just meteorological. A 30% utilization decline at affected hubs and an almost-half reduction for UPS and Atlas Air operations at Memphis force a planning system to answer a capacity question.[2]
A credible platform should show what freight can be pulled into earlier departures, what can move through an alternate hub, what must be downgraded or delayed, and where substitute capacity creates a second-order bottleneck. A weak implementation can still say “rerouted” while missing the customer window because alternate capacity was never constrained realistically.
3. Recovery Has To Be Modeled Across Days, Not Cleared As An Alert
Hurricane Ian’s reported 2.5-day shipping-time extension is the part many dashboards underplay.[3] Storm impact does not end when the radar image improves. Aircraft, crews, ground handlers, dock doors, warehouse labor, road access, and missed sort cycles all create a recovery curve.
For planning directors, this is where scenario engines earn or lose trust. The useful model does not merely ask, “What if the hub closes?” It asks how the network behaves on Day 1, Day 2, and Day 3 of constrained recovery, which orders remain worth expediting, and which customer promises need to be reset before service teams are left explaining a miss that the planning model should already have seen.
Platform Comparison: What Can Be Said From The Available Evidence
The public evidence reviewed here does not include a current crawl of vendor documentation, published customer case studies, or post-storm implementation audits for o9, Blue Yonder, Kinaxis, RELEX, or Anaplan. That constraint matters. No platform should receive credit for storm-specific routing behavior unless the claim is tied to public documentation, a named customer reference, or an independently verified event review.
The matrix below is therefore not a winner ranking. It is a buyer-grade comparison screen: what each vendor must prove against the same storm-disruption criteria, and what verification level is available from the evidence reviewed here.
| Platform | Weather Intelligence To Lane-Level Probability | Hub-Outage Rerouting And Capacity Allocation | Multi-Day Recovery Modeling | Verification Level In This Article |
|---|---|---|---|---|
| o9 | Must demonstrate how external weather signals become lane, hub, and order-risk calculations rather than dashboard alerts | Must show constrained alternate routing when a primary air hub loses throughput | Must show rolling recovery scenarios over multiple days, including service-window and inventory effects | Not independently confirmed in the public evidence reviewed here; vendor claims require documentation or customer proof |
| Blue Yonder | Must demonstrate weather-risk ingestion tied to transportation planning decisions at lane level | Must show whether rerouting logic reallocates scarce carrier and hub capacity after a storm event | Must show whether scenario planning carries disruption effects beyond initial closure into recovery days | Not independently confirmed in the public evidence reviewed here; vendor claims require documentation or customer proof |
| Kinaxis | Must demonstrate how rapid planning signals incorporate weather exposure into shipment, supply, and demand consequences | Must show how concurrent planning handles hub capacity loss and competing shipment priorities | Must show whether recovery scenarios update customer commits as infrastructure constraints ease | Not independently confirmed in the public evidence reviewed here; vendor claims require documentation or customer proof |
| RELEX | Must demonstrate whether weather disruption signals connect to air-freight lane decisions, not only inventory or demand planning | Must show how hub interruption affects replenishment flows and transport capacity choices | Must show how multi-day transport recovery changes store, DC, or customer-service outcomes | Not independently confirmed in the public evidence reviewed here; vendor claims require documentation or customer proof |
| Anaplan | Must demonstrate whether connected planning models can operationalize weather feeds into lane-level risk calculations | Must show how scenario models allocate constrained alternate capacity after a hub outage | Must show whether recovery-time assumptions are governed, refreshed, and linked to downstream financial and service impacts | Not independently confirmed in the public evidence reviewed here; vendor claims require documentation or customer proof |
That may look unsatisfying if the goal is a clean “best platform” answer. It is more useful than pretending that general risk-management language proves storm-disruption performance. The missing evidence is not cosmetic. It is the difference between a platform that can display Hurricane Ian and one that can model the 75% shipment reduction and 2.5-day time extension as planning constraints.[3]
How To Read The Five Platforms Against The Storm Test
o9
For o9, the evaluation should start with model depth. If a vendor team describes an enterprise knowledge model, digital brain, or integrated planning graph, the storm-specific question is whether weather exposure changes the transportation plan at the lane and order level. A useful demonstration would start with the threatened hub, identify the exposed lanes, calculate which customer windows are likely to fail, and then show constrained alternatives.
The buyer should ask for proof that the model handles capacity scarcity after the first reroute. If every shipment simply moves to an alternate hub in the demo, the scenario is not comparable to Izzy’s hub utilization shock.[2] The implementation evidence to request is a documented workflow showing how air capacity, service commitments, and recovery timing are recalculated when the primary node remains impaired for multiple days.
Blue Yonder
Blue Yonder should be tested on the boundary between transportation execution visibility and planning intervention. Seeing a threatened lane is not enough. The platform needs to show when a weather signal changes route selection, carrier assignment, appointment planning, or shipment prioritization.
The practical RFP test is a hub-outage drill. Feed the same Category 3 hurricane scenario into the planning process and ask the team to show which shipments move early, which shift to alternate hubs, which lose service feasibility, and how the model prevents planners from overbooking the same substitute capacity. ChainSignal’s separate Blue Yonder vs. Kinaxis comparison is a useful companion for broader planning-platform tradeoffs, but storm response still has to be proven in the air-freight workflow.
Kinaxis
Kinaxis should be evaluated on response speed and concurrency. Storm disruption is not a transportation-only event once inventory, allocation, customer promises, and production schedules are affected. The strongest proof would show weather-driven hub capacity loss flowing into those dependent plans without waiting for a batch planning cycle that arrives after the customer window has already collapsed.
The harder question is recovery modeling. A platform can be fast and still shallow if it clears the exception after a reroute. Hurricane Ian’s reported 2.5-day shipping-time extension is a useful test because it requires the model to carry delayed recovery through downstream commitments, not just identify the first disruption.[3]
RELEX
RELEX needs a slightly different screen because many buyers encounter it through retail, replenishment, and demand-planning contexts. For air-freight-heavy disruption planning, the question is whether weather-driven transport constraints are modeled deeply enough to change replenishment and service outcomes, rather than appearing as a downstream exception that planners handle manually.
The right demo is not a generic inventory scenario. It is a storm-constrained flow into distribution centers or stores where air freight is used to protect availability. If the hub closes or loses throughput, the model should expose which products still justify constrained air capacity and which promises should be reset because the recovery curve makes expedited movement uneconomic or infeasible.
Anaplan
Anaplan should be tested as a connected scenario-planning environment. That can be valuable when storm effects need to be translated into financial exposure, service tradeoffs, and executive decisions. The risk is that a flexible planning model can become a spreadsheet-shaped control tower if weather signals are not operationalized into governed assumptions and transportation constraints.
The evidence to request is a governed storm playbook inside the model: named assumptions for hub closure, capacity loss, alternate-lane cost, recovery duration, and customer-window impact. Those assumptions should be refreshed as conditions change, not pasted into a scenario after operations has already improvised the answer.
The Shared Gap: Verification After A Real Storm
The most important missing artifact is the one vendors rarely lead with: a verified post-storm implementation audit. Public disruption benchmarks from CargoAi, Spire, and Everstream are available, but they do not show that any one of the five platforms reduced delays, protected customer windows, or improved recovery during a named air-freight storm event.[1][2][3]
That does not mean the platforms lack the capability. It means the buyer should treat unsupported claims as provisional. Vendor screenshots, weather overlays, and AI-risk language need to be tied to a working chain of decisions: external signal, lane risk, hub capacity loss, alternate routing, constrained allocation, revised ETA, customer-impact view, and recovery scenario.
This is also where architectural language can matter, but only when it explains execution depth. A platform that is AI-native, AI-enhanced, or model-driven still has to prove how the weather signal enters the planning object model. ChainSignal’s AI-native vs. AI-enhanced framework can help separate architecture from marketing, but storm-disruption planning remains an operational test.
What A Serious Buyer Should Ask For
A good storm-disruption demo should not begin with a global risk map. It should begin with a specific threatened hub, a set of exposed lanes, current carrier capacity, customer delivery windows, and recovery assumptions. Then the vendor should run the same scenario twice: once as a pre-landfall planning exercise and once as a post-impact recovery exercise.
- Show the source, update frequency, and governance of weather-intelligence inputs.
- Translate the storm signal into lane-level and hub-level disruption probabilities.
- Constrain alternate routing by carrier, hub, ground-handling, and service-window capacity.
- Carry recovery assumptions across multiple days instead of closing the alert after the first reroute.
- Expose which orders, customers, and revenue commitments change because of the storm scenario.
- Provide a public case study, customer reference, or audit trail from a real disruption if available.
The cleanest conclusion from the evidence is deliberately narrow. Storm-disruption planning for air freight is best evaluated through weather-intelligence integration, hub-outage rerouting, and multi-day contingency modeling. Until o9, Blue Yonder, Kinaxis, RELEX, or Anaplan ties storm-response claims to public documentation, named customer evidence, or a verified post-storm audit, any claim of superiority should stay provisional.
References
- Air cargo on-time performance drops in 2025, Air Cargo News, Jan 2026.
- How winter storms disrupt air cargo operations, Spire Global.
- Weather-Proof Your Logistics Operations, Everstream Analytics.
- Shipping industry and ports susceptible to billions of dollars in damage, disruption from climate change, Environmental Defense Fund, Mar 2022.
§ 42 — Cited evidence
Flag an inaccuracy or submit a comparable account — Contribute or read how claims are verified in Methodology.