
§ 41 — Use-case analysis
What Hurricane Fausto Reveals About AI Planning ROI
Only two independently documented ROI data points exist for AI planning systems in hurricane scenarios. This article examines what they actually measure, where the evidence gaps are, and how to build a credible business case despite sparse data.
- Function
- inventory-optimization
- AI technique
- forecasting
- Evidence source
- ClimateAi Hurricane Ian case study (2023)
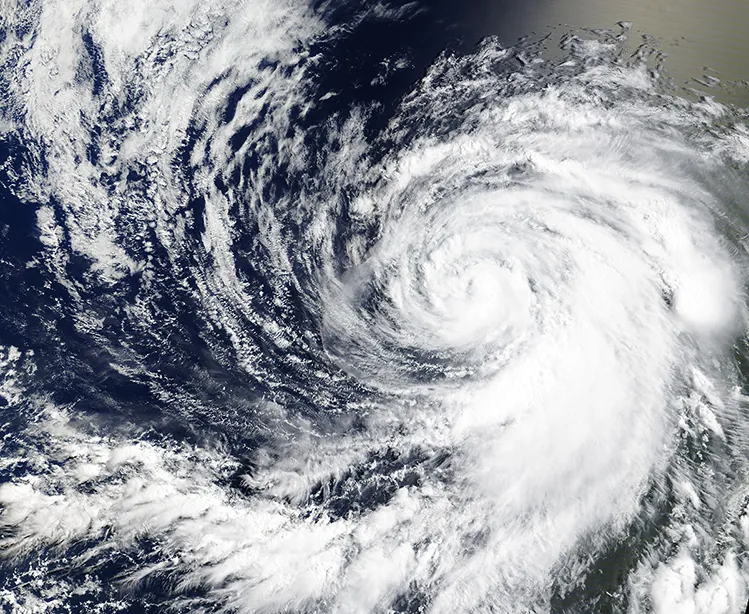
As of July 25, 2026, at 09:00 UTC, Hurricane Fausto was a Category 2 storm in the Eastern Pacific with sustained winds of 100 mph, tracking westward with no coastal warnings in effect. The practical impacts listed at that point were mainly prospective swell conditions for the Baja California Peninsula and Southern California, with possible swells reaching Hawaii on July 26–27.[1]
That makes Fausto useful for a planning conversation, but not for an ROI claim. A live storm can justify attention before it produces financial evidence. It can trigger lane reviews, inventory checks, supplier outreach, and exception monitoring. What it cannot do, while the impact is still prospective, is prove that an AI planning system paid for itself.
That distinction matters because a search for Fausto, supply chain disruption, and AI planning can make the issue sound like it should point to an immediate technology answer. In finance terms, it points first to a measurement problem. Is the system warning earlier? Is it moving inventory? Is it preserving production hours? Is it capturing demand after a storm? Those are different benefits, with different owners and different denominators.
The Two Numbers That Can Actually Be Used
As of Q3 2026, the public ROI evidence relevant to AI planning for hurricane-related disruption is thin enough to fit on one slide. There are two usable data points: ClimateAi’s Hurricane Ian case, where a roofing materials producer captured $15 million in incremental sales after receiving an elevated disruption-risk signal two to three weeks before landfall, and GM’s report that its AI supply chain stack prevented more than 75 factory stoppages in 2025 across all disruption types.[2][3]
Both numbers matter. Neither should be copied into a generic payback model without labels.
| Data point | What it measures | Why it is useful | Main caveat |
|---|---|---|---|
| ClimateAi Hurricane Ian case | $15M in incremental sales from pre-positioned inventory | Only hurricane-specific operational ROI example in the public record | Revenue capture, not avoided disruption cost; vendor-published case study |
| GM AI supply chain stack | 75+ factory stoppages prevented in 2025 | Best public scale signal for AI-enabled disruption management | Aggregates all disruption types; hurricane-specific subset is not disclosed |
| Everstream/Security Magazine disruption-cost figure | $184M/year average disruption cost | Useful background for why disruption exposure deserves attention | Not hurricane-specific and not reliable as a company-level ROI input without adjustment |
The table is deliberately unsatisfying. It does not produce a clean payback number. It does something more useful for a planning director: it prevents three unlike quantities from being treated as if they answer the same question.
ClimateAi’s Hurricane Ian Case Is Revenue Capture, Not Cost Avoidance
The ClimateAi case is the strongest hurricane-specific example because it ties the planning signal to an operational action. A roofing materials producer received a 30% to 50% elevated disruption-risk signal two to three weeks before Hurricane Ian made landfall, pre-positioned inventory ahead of expected demand, and reported $15 million in incremental sales.[2]
That is a real chain of events: signal, lead time, inventory movement, demand capture, revenue outcome. It is also a specific category of benefit. The $15 million is not proof that the company avoided $15 million of losses. It is not a reduction in freight premiums, a reduction in plant downtime, or a reduction in write-offs. It is incremental sales that became available because inventory was in position when demand arrived.
For a CFO-facing model, that means the gross number is only the starting point. The planning team would still need to convert sales into contribution margin, subtract incremental positioning costs, identify any service-level tradeoffs elsewhere in the network, and avoid double-counting demand that would have been captured later through normal replenishment. The case can support a revenue-capture scenario. It cannot, by itself, support a broad claim that hurricane AI planning avoids disruption costs at the same dollar value.
The evidence quality also needs a label. The case is vendor-published, not independently audited, but it includes a named vice president of supply chain quote and a described sequence of operational decisions.[2] That makes it more useful than a generic capability page, but still less definitive than a third-party post-mortem with audited financial attribution.
GM Shows Scale, But Not a Hurricane-Specific Payback
GM’s reported result is larger in operational scope. In 2025, the company said its internally built AI supply chain stack — including SupplyMap, Risk Intelligence, SupplyHealth, and SupplyAlert — prevented more than 75 factory stoppages.[3][4] A separate TraxTech analysis values each prevented factory stoppage at $500,000 to $2 million, citing automotive manufacturer data.[5]
It is tempting to multiply those figures and put a large avoided-cost range in the business case. A planning director can use the math as a sensitivity check, but not as a hurricane-specific ROI proof. GM’s 75-plus stoppages include disruption types beyond hurricanes, such as material shortages, semiconductor constraints, and geopolitical disruptions.[3] The public reporting does not disclose how many of the prevented stoppages were weather-related, how many were hurricane-related, or how the avoided stoppages were financially validated.
The useful claim is narrower: AI-enabled disruption monitoring and supplier-risk workflows have been reported at automotive scale, with more than 75 stoppages prevented across a broad disruption portfolio. That is meaningful for a company whose plants face high downtime costs. It is not the same as saying that an AI hurricane-planning module will prevent a predictable number of hurricane stoppages next year.
GM is especially relevant because stoppage avoidance is closer to the language finance teams use for resilience investments. A stopped line has waiting labor, missed output, expediting, supplier escalation, and customer-service consequences. But the more attractive the avoided-cost number becomes, the more carefully it needs to be scoped. If the hurricane subset is not disclosed, the model should not pretend it is.
The $184M Figure Belongs in the Risk Context, Not the ROI Cell
The most portable number in disruption presentations is often the least safe one to use as a direct ROI input. Everstream Analytics and Security Magazine reported an average annual disruption cost of $184 million in 2024.[6] The figure is useful as background evidence that disruption exposure is financially material. It is not a hurricane-specific cost baseline.
The problem is scope. The $184 million figure covers all disruption types and all company sizes.[6] A regional distributor exposed to Gulf Coast storms, a global automotive manufacturer, and a food retailer with weather-sensitive demand do not share the same denominator. If the number enters a hurricane ROI model unchanged, it becomes a shortcut around the hard work: identifying the company’s affected lanes, facilities, products, suppliers, revenue pools, and downtime exposure.
Macro risk data still has a place. Everstream’s 2026 risk report identifies extreme weather as the second-biggest supply chain threat with a 93% threat level, describes tropical cyclones as the leading cause of supply chain losses globally over the last decade, and reports that global flood losses have risen 27% since 2000.[7] Those figures support the case for taking weather disruption seriously. They do not quantify what a specific AI planning implementation will return.
Where Vendor Claims Help, and Where They Stop
For teams evaluating o9, Blue Yonder, Kinaxis, RELEX, or Anaplan, the public vendor material is useful for capability mapping. It can show whether the platform supports weather feeds, scenario planning, multi-echelon inventory decisions, control-tower workflows, supplier-risk monitoring, or digital twin simulations. It should not be treated as independently verified hurricane ROI.
Blue Yonder’s Network Resilience framework, for example, describes a three-stage approach: anticipate through AI monitoring, absorb through multi-echelon inventory optimization, and recover through digital twin simulations.[8] That is a coherent architecture for disruption response. It does not disclose audited hurricane outcomes, avoided cost, or realized payback.
RELEX’s published claim of a 75% forecast-error reduction for weather-sensitive products is another useful but bounded data point.[9] Forecast-error reduction is not the same as supply disruption prediction. A better demand forecast can support store replenishment, allocation, and labor planning around weather-sensitive categories. It does not prove that a supplier disruption, port delay, or factory stoppage was avoided.
The practical rule is simple: vendor capability claims can define what the platform might do; outcome evidence must show what changed after someone used it. If the evidence stops at architecture, the business case should stop at capability enablement and modeled assumptions.
How to Build the Business Case Without Blending the Math
A credible AI planning business case for hurricane disruption does not need perfect evidence. It needs clean categories. The first version should separate at least four benefit types before any payback calculation is shown.
- Revenue capture: sales gained because inventory, capacity, or service coverage was positioned before storm-driven demand arrived.
- Cost avoidance: downtime, expediting, spoilage, demurrage, penalty, or emergency procurement costs that did not occur because the organization acted earlier.
- Risk exposure: the company’s baseline vulnerability to weather disruption, stated by lane, site, supplier tier, product family, or customer segment.
- Capability description: the platform functions that make earlier sensing, simulation, allocation, or escalation possible.
ClimateAi belongs in the revenue-capture column. GM belongs in the stoppage-avoidance column, with a scope warning. Everstream belongs in the risk-exposure section. Blue Yonder, RELEX, and the other platform materials belong in the capability section unless they provide measured outcomes. Once those categories are separated, the conversation becomes less theatrical and more defensible.
A planning director can then build scenarios without overstating the source material. For a revenue-capture case, the model might start with products whose demand rises before or after storms, estimate the margin available from earlier positioning, and deduct incremental inventory, freight, and redeployment costs. ClimateAi’s $15 million case can be cited as an example of the mechanism, not as a transferable expected value.[2]
For a stoppage-avoidance case, the model should identify facilities or suppliers where weather disruption could interrupt production, estimate the cost of a lost shift or line stoppage using internal finance data, and then apply conservative probability and effectiveness assumptions. GM’s 75-plus prevented stoppages can support the argument that AI-enabled disruption workflows have operated at scale, while the TraxTech range can provide an external reasonableness check for stoppage value.[3][5] Neither replaces company-specific downtime economics.
For macro exposure, the model should stay descriptive unless the company has internal loss history. Everstream’s figures can justify why the board should care about weather disruption, especially tropical cyclones and flooding.[7] They should not be multiplied by a guessed reduction percentage and presented as payback.
The CFO Slide Should Show the Gaps
The strongest version of the business case is not the one with the fewest caveats. It is the one where the caveats are visible before someone in finance has to ask for them.
| Business-case line | Acceptable evidence | Do not claim |
|---|---|---|
| Storm-driven revenue capture | ClimateAi Hurricane Ian case; internal margin and demand data | That $15M is an avoided-cost benchmark |
| Production stoppage avoidance | GM stoppage-prevention report; internal downtime cost; TraxTech valuation range as context | That GM’s full 75+ stoppages were hurricane-related |
| Weather disruption exposure | Everstream macro risk data; internal incident history | That $184M/year is the company’s hurricane loss baseline |
| Platform capability | Vendor architecture and feature documentation | That capability descriptions are independently verified ROI |
This approach may produce a less dramatic ROI range than a blended vendor model. It also gives the planning team a better answer when finance asks what each number measures. The denominator is no longer hidden. Revenue is not mixed with avoided cost. Macro exposure is not treated as captured savings. Platform features are not mistaken for outcomes.
What Fausto Can and Cannot Prove
Fausto is exactly the kind of event that makes AI planning feel urgent. A storm in the Pacific can affect ocean conditions, logistics timing, safety decisions, and demand signals before it creates a clean loss event. For planning teams, that early ambiguity is the point. Systems are valuable when they create usable lead time, not when they merely decorate the post-mortem.
But as of the July 25 advisory, Fausto was not a completed supply chain disruption case. There were no coastal warnings in effect, and the stated impacts were mainly swell-related and prospective.[1] Any ROI claim tied to Fausto would need to wait for measured outcomes: what decisions were made, what costs were avoided, what sales were captured, what would likely have happened without the intervention, and who verified the result.
AI planning for hurricane disruption has enough documented evidence to support a serious business-case conversation. It does not have enough public evidence to support generic payback claims. Fausto can justify planning attention before landfall consequences are known; the ROI case begins only when the outcome is measured, sourced, and scoped.
References
- NOAA NHC Advisory Archive, NOAA National Hurricane Center
- Accurate Hurricane Forecasting Helps Roofing Materials Producer Come Out on Top, ClimateAi, March 2023
- Business Insider interview with GM executives on AI supply chain tools, Business Insider, September 2025
- GM News statement by Jeff Morrison on AI supply chain stack, GM News, August 2025
- Why Predictive AI Actually Works in Supply Chains, TraxTech, 2024
- Everstream Analytics/Security Magazine research on average annual disruption cost, Security Magazine, 2024
- Are You Prepared for the Supply Chain Disruptions of 2026?, Everstream Analytics
- Blue Yonder Network Resilience, Blue Yonder
- RELEX weather-sensitive demand forecasting claim, RELEX
§ 42 — Cited evidence
Flag an inaccuracy or submit a comparable account — Contribute or read how claims are verified in Methodology.