§ 41 — Use-case analysis
How AI planning platforms stack up against Super El Niño disruptions
The 2026-2027 Super El Niño forecast puts four key supply chain zones at risk, but can the leading AI planning platforms actually model these scenarios? This article maps the disruption zones to platform capabilities and reveals where vendor claims remain unvalidated.
- Function
- demand-forecasting
- AI technique
- forecasting
- Failure pattern
- unvalidated climate scenario modeling
- Evidence source
- Everstream Analytics
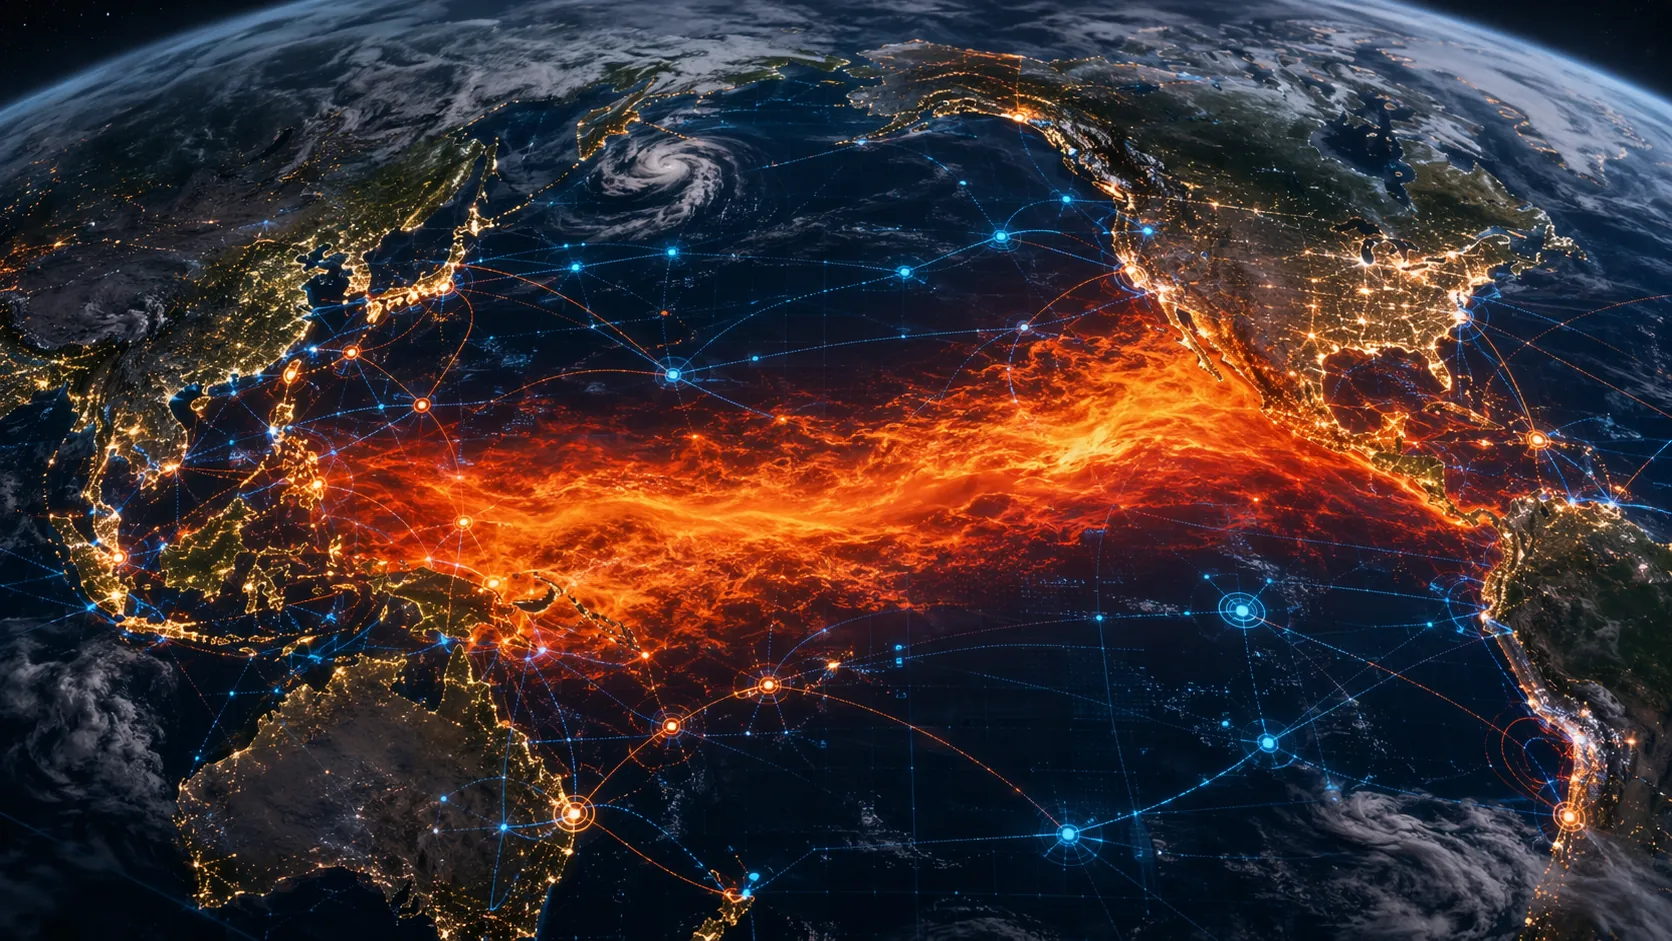
The 2026-2027 El Niño forecast starts as a climate signal, but for supply-chain planning it should not stay there for long. As of July 2026, NOAA’s Climate Prediction Center gives the November-January 2026-2027 period a 63% probability of reaching “very strong” El Niño classification, while ECMWF ensemble guidance cited by Severe Weather Europe shows sea-surface temperature anomalies peaking above +3°C in the tropical Pacific.[1][2] That is a serious scenario input. It is not yet an operating plan.
For a planning team, the useful question is narrower: which variables would move first, how long the lag would be, and whether an AI planning platform can reproduce that sequence from prior ENSO events before it is trusted with winter 2026-2027 decisions. The current forecast points to four planning zones that are concrete enough to parameterize rather than simply monitor.
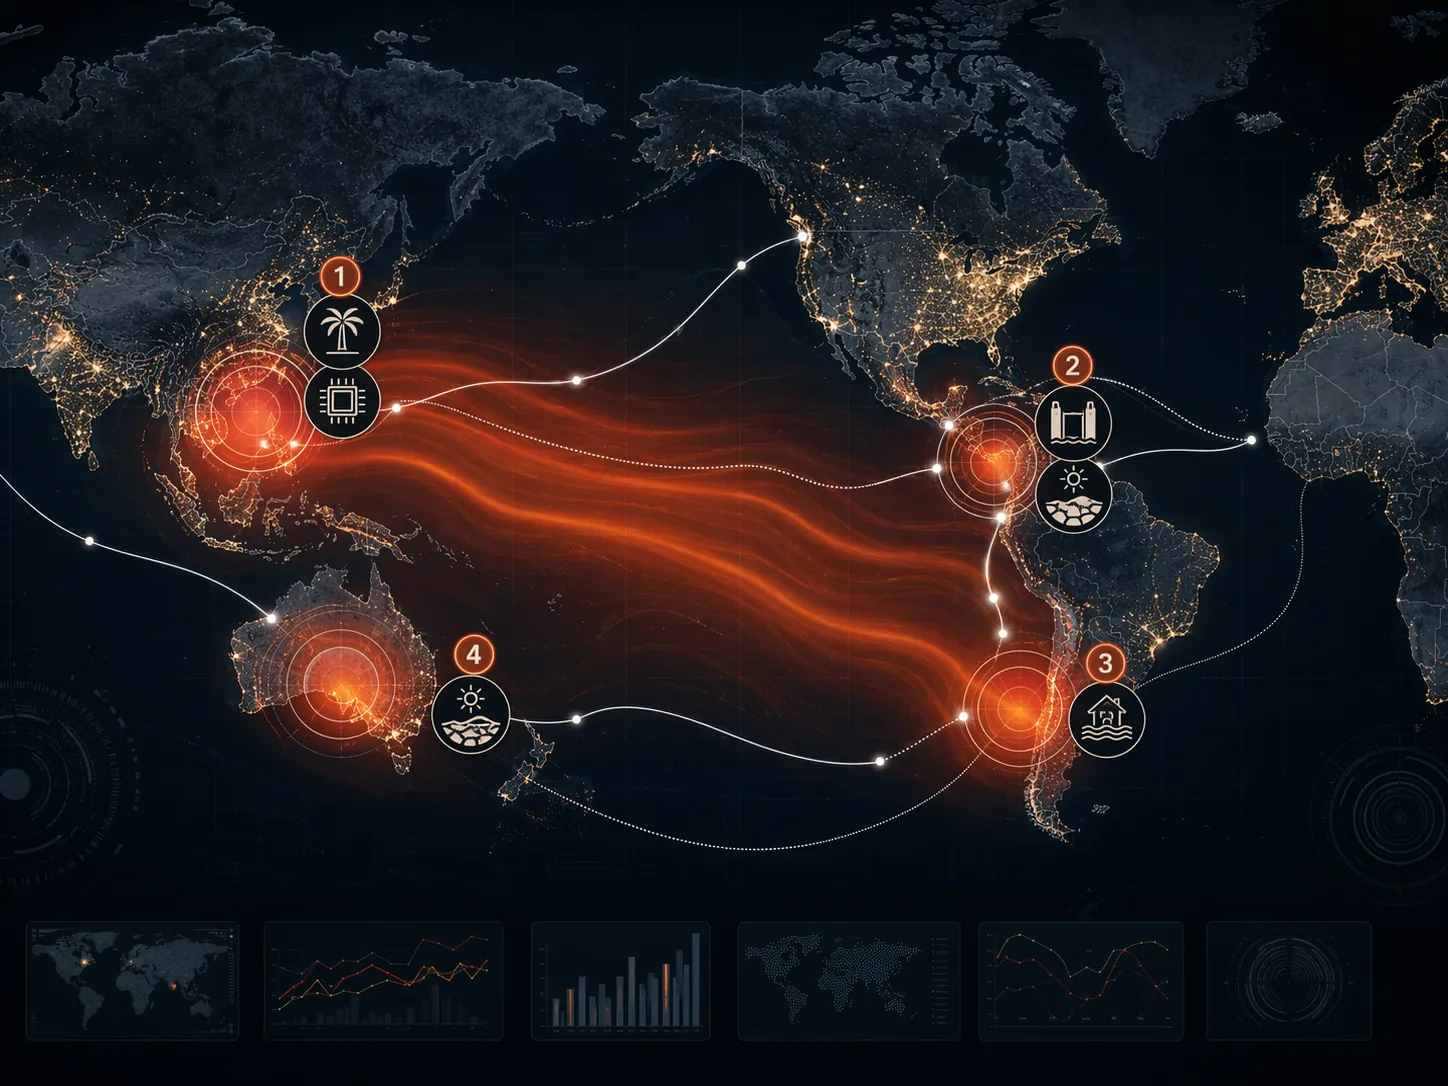
Four disruption zones worth modeling before winter
The first zone is Southeast Asia. Crisis24 flags drought and heat risks across the region, with palm oil, rice, and electronics supply chains exposed.[3] Malaysia’s economic minister has already pointed to an expected 8-10% palm oil yield drop under the developing El Niño conditions, while Taiwan’s dry-season water availability remains linked to ENSO phase in a way that matters for semiconductor operations.[3][4] A planning model does not need to “understand climate” in the abstract here. It needs to translate rainfall deficits into yield assumptions, water-allocation assumptions, supplier output constraints, and replenishment timing.
The second zone is Central America and the Panama Canal. This is the cleanest test case because the operating variable is visible: water levels constrain vessel draft, daily transits, booking slots, and rerouting decisions. Everstream’s work on the La Niña-to-El Niño transition highlights a 3-6 month lag between rainfall deficits and canal draft restrictions, and prior drought episodes saw ship transits fall from 36 to 25 per day.[5] That lag is exactly the kind of sequence a serious simulation should be able to replay.
The third zone is southern U.S. and western South America flooding. The operational issue is not only physical damage. It is the extra variability imposed on inland transport, port access, agricultural movement, and inventory positioning when rainfall arrives in bursts rather than averages. Crisis24 identifies flooding risk in these regions under the 2026-2027 El Niño setup.[3]
The fourth zone is the Australian wheat belt. TT Club describes the risk of drought conditions and precipitation running 20-40% below normal in affected Australian grain regions under a Super El Niño scenario.[6] In planning terms, that does not become useful as a red patch on a map. It becomes useful when it changes crop-size assumptions, export availability, substitute-origin rules, forward-buy decisions, and exposure to freight capacity on alternative lanes.
| Planning zone | Primary stressor | Variables an AI planning platform would need to expose |
|---|---|---|
| Southeast Asia | Dryness, heat, water scarcity | Palm oil yield assumptions, rice availability, semiconductor water constraints, supplier allocation rules |
| Panama Canal | Rainfall deficit leading to draft and transit restrictions | 3-6 month lag, vessel draft limits, daily transit capacity, booking priority, rerouting cost and delay |
| Southern U.S. and western South America | Flooding risk | Plant and port access, inland transport reliability, safety-stock placement, shipment delay distributions |
| Australian wheat belt | Drought and below-normal precipitation | Crop-size assumptions, export availability, substitute-origin decisions, freight and commodity exposure |
The Panama Canal is the stress test vendors should not be allowed to blur
A vague climate-risk module can always produce a high-risk score. The Panama Canal case asks for more. It has a meteorological input, a water-system lag, an infrastructure constraint, a throughput cap, and then a logistics consequence. If a vendor says its digital twin can model El Niño disruption, this is where the claim should become auditable.
The model would need to show when rainfall deficits enter the scenario, how those deficits are converted into canal water-level assumptions, when draft restrictions are triggered, how daily vessel capacity changes, which lanes absorb rerouted freight, and which customers receive constrained inventory first. The point is not that the platform must predict the Canal Authority’s next rule perfectly. The point is that it should make the chain of assumptions visible enough for logistics, procurement, finance, and customer service to argue over the same version of reality.
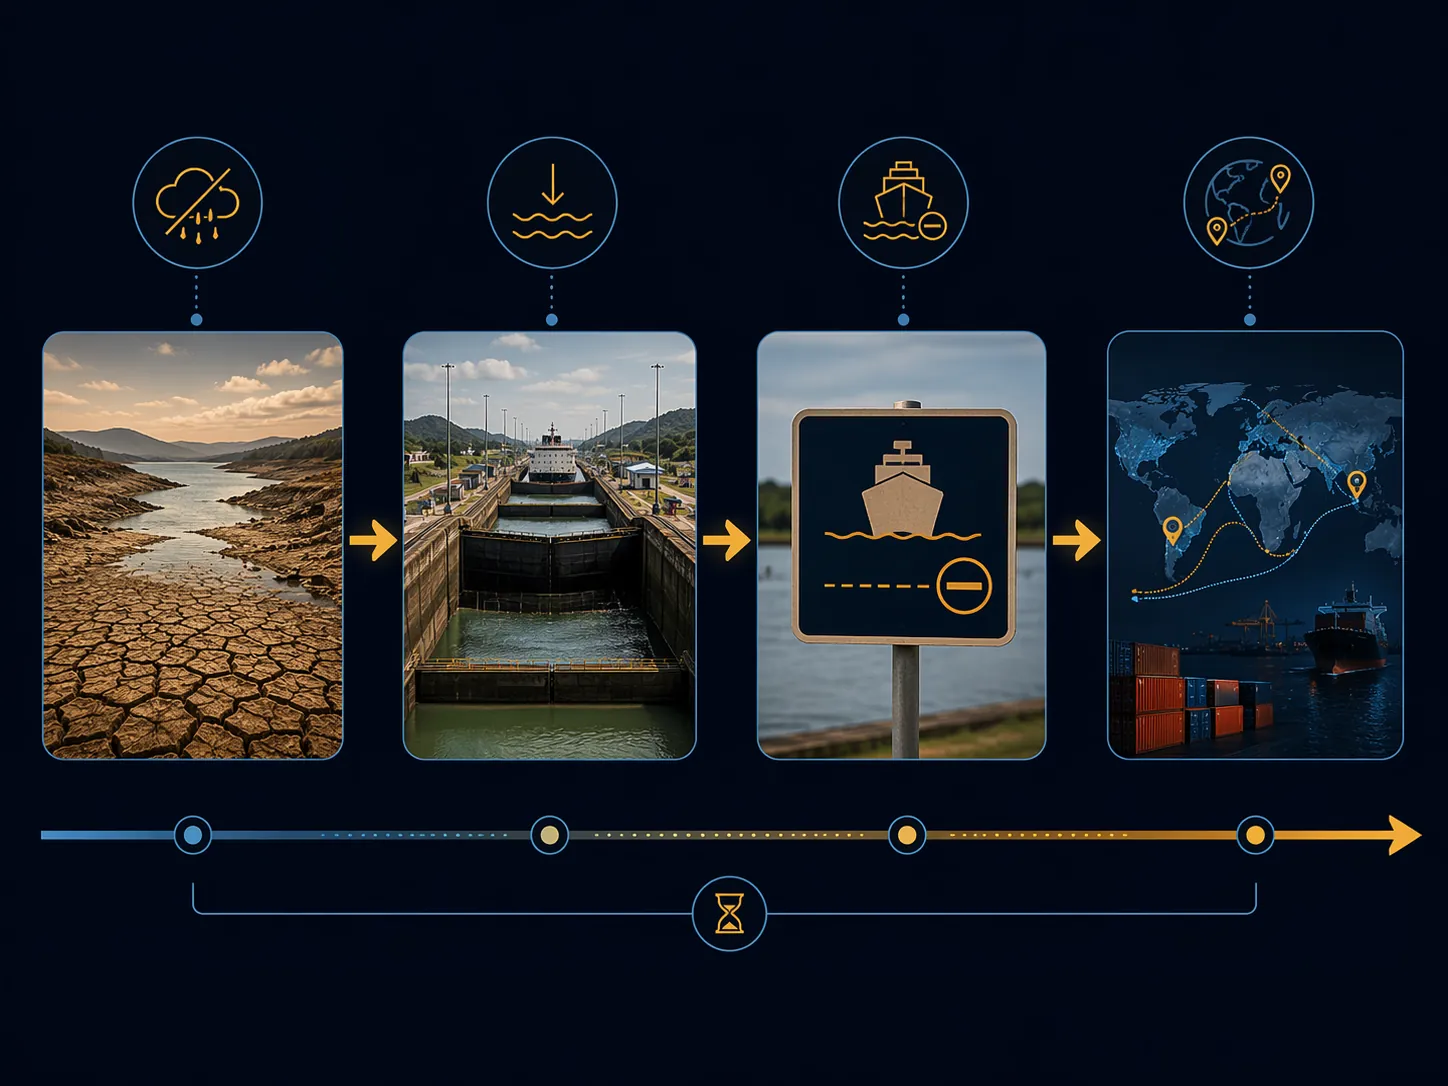
This is also where historical validation should be least negotiable. Everstream’s 3-6 month rainfall-deficit-to-restriction lag and the prior 36-to-25 ships-per-day reduction give the platform a known sequence to reproduce.[5] A vendor that cannot show whether its model would have detected that lag in past data may still have useful planning software. It has not publicly proved El Niño canal-readiness.
The economic stakes are large, but they do not validate any platform
The macro history explains why this forecast deserves planning attention. Callahan and Mankin estimated that the 1997-98 El Niño caused $5.7 trillion in global income losses and the 1982-83 event caused $4.1 trillion.[7] FAO reported that the 2015-16 El Niño impaired food security for 60 million people.[8] TT Club also points to commodity-price pressure from recent climate-linked disruption, including a 250% cocoa price surge during the 2023-24 El Niño period.[6]
Those figures justify urgency, not trust. They do not tell a planning director whether o9, Kinaxis, Blue Yonder, RELEX, Anaplan, or an internal machine-learning stack can turn a Pacific sea-surface anomaly into a credible supplier-allocation scenario. The vendor evaluation still has to happen at the level of operating variables.
What the major planning platforms appear to offer
The large planning suites have capabilities that sound relevant to a Super El Niño scenario. o9 markets integrated business planning and digital-twin-style decision models. Kinaxis is associated with concurrent planning and scenario simulation. Blue Yonder has been moving toward control-tower orchestration, strengthened by its FourKites relationship. RELEX is strong in demand forecasting and replenishment planning. Anaplan is widely used for connected planning across finance, supply chain, and commercial teams.
Those broad capability categories matter. A planning team facing drought-driven palm oil allocation, canal restrictions, flood delays, and wheat-origin substitutions needs cross-functional scenario management. It needs demand plans, supply plans, inventory rules, freight assumptions, financial impacts, and customer promises to move together rather than through spreadsheet relays.
But the published evidence does not yet match the climate-resilience language. As of July 2026, the available sources identify no public case study from o9, Kinaxis, Blue Yonder, RELEX, or Anaplan showing validation against historical ENSO disruption data. That distinction matters. A platform may support scenario simulation and still not have demonstrated that it can reproduce the lag structure, severity, and operational handoffs of a prior El Niño event.
| Platform | Relevant capability category | Published ENSO-specific validation found in the provided research |
|---|---|---|
| o9 | Integrated business planning, digital-twin-style decision modeling | No public El Niño or historical ENSO validation case identified |
| Kinaxis | Concurrent planning, scenario simulation | No public El Niño or historical ENSO validation case identified |
| Blue Yonder | Control tower, orchestration, logistics visibility through FourKites direction | No public El Niño or historical ENSO validation case identified |
| RELEX | Demand forecasting, replenishment, retail and consumer-goods planning | No public El Niño or historical ENSO validation case identified |
| Anaplan | Connected planning across finance, supply chain, and commercial functions | No public El Niño or historical ENSO validation case identified |
Market direction is not the same as El Niño readiness
ABI Research’s MODEX 2026 coverage shows why the market is moving in this direction. Blue Yonder and FourKites were part of the broader agentic control-tower conversation, and ABI’s Ryan Wiggin wrote that buyers were asking for “technologies that deliver clear operational value — not vague promises.”[9] That quote is useful because it sets the right bar. The operational value must be shown in the disruption sequence, not in the label attached to the software.
ABI’s survey of 490 supply chain professionals found that 65% rated AI as important in purchase decisions, while its analysis also described C-level executives as viewing AI agents more as tactical tools than strategic decision-makers.[9] That is an adoption and intent signal. It is not proof that an agentic control tower can handle canal draft limits, palm oil yield loss, semiconductor water rationing, flood-related route variability, and wheat-origin substitution in one coherent winter scenario.
The readiness gap is just as important. Dataiku’s 2026 supply-chain AI trends report, citing DP World survey work, says 78% of supply chain leaders expect disruptions to intensify, but only 25% feel prepared.[10] That gap explains why climate-resilience messaging is attractive. It also explains why buyers should be careful: a market that feels underprepared is a market inclined to overvalue confident demos.
Digital twins are part of the same pattern. Dataiku describes supply-chain AI and digital-twin use cases, including scenario modeling around disruptions such as labor shocks and tariff impacts.[10] Those examples are relevant to planning architecture. They do not establish that El Niño-specific climate anomaly libraries are standard, validated features inside the major planning suites.
The ClimateAi exception clarifies the proof standard
ClimateAi’s FICE model is the important exception in the research set because it is explicitly described as an AI system designed to quantify weather-related demand and supply disruption timing and magnitude.[11] That is much closer to the actual problem than a generic dashboard that colors regions by risk.
It should not be stretched beyond what it shows. FICE is a weather-integrated AI example, not published evidence that the major planning suites have validated ENSO scenarios across procurement, logistics, inventory, and finance. Its value here is to prove that more specific climate-aware modeling exists, and to make the evidentiary gap around general planning platforms easier to see.
What would count as evidence
For the 2026-2027 winter scenario, the question is not whether a platform can generate a plausible disruption narrative. Any competent sales team can do that. The question is whether the platform can show its assumptions, reproduce known historical patterns, and carry consequences through planning decisions without hiding the weak links.
For Southeast Asia, that means tying dryness assumptions to palm oil yield, rice availability, semiconductor water constraints, supplier commitments, and allocation logic. For the Panama Canal, it means reproducing the rainfall-deficit-to-restriction lag and showing the change in transit capacity, rerouting, lead time, and service impact. For southern U.S. and western South America flooding, it means showing how transport uncertainty changes safety-stock placement and shipment promises. For Australia, it means making wheat production assumptions alter sourcing and commodity exposure rather than merely appearing as a regional warning.
The most useful vendor proof would be a back-test against prior ENSO periods: what the model would have signaled, when it would have signaled it, which operational variables changed, and how its recommended actions compared with what actually happened. A second-best proof would be a comparable climate-disruption validation where the lag structure, capacity constraint, and downstream planning effects are documented. A demo built only on synthetic assumptions can still be useful for workshop alignment, but it is not validation.
The buyer’s stance for Q3 2026
The forecast is probabilistic. The impacts will not land evenly. Some regions may avoid the worst-case pattern, and some private implementations may be more capable than the public evidence suggests. Absence of published ENSO validation is not proof that a platform cannot do the work.
It does prove a different thing: the climate-resilience claim has not been publicly demonstrated by the major planning vendors against the kind of historical ENSO disruption data that would matter for winter 2026-2027. That leaves planning directors with a practical line to hold. Do not buy “digital twin,” “agentic control tower,” or “resilience” as a general platform attribute. Ask the vendor to model the four zones, reproduce the Panama lag where applicable, disclose the assumptions, and show what evidence supports the output.
References
- ENSO Diagnostic Discussion — NOAA Climate Prediction Center
- Fall 2026 Forecast: Super El Niño Sets Up a Winter-Like Weather Pattern — Severe Weather Europe
- El Niño 2026-2027: Global Weather, Supply Chain, and Infrastructure Risks — Crisis24
- Impacts of an impending 'Super' El-Niño on global supply chains — PreventionWeb / Observer Research Foundation
- Weather Risk for Supply Chains: The Transition from La Niña to El Niño — Everstream Analytics
- TT Talk - Super El Niño: a looming systemic shock to global supply chains? — TT Club
- Persistent effect of El Niño on global economic growth — Science, 2023
- El Niño and the Storm Brewing in Supply Chains — Aon
- Supply Chain Disruptions 2026: How to Build Resilience with AI and Automation — ABI Research
- Supply Chain AI Trends 2026: Building Resilient Operations — Dataiku
- AI Weather Forecasting and Supply Chain Risk Management — TraxTech / ClimateAi
§ 42 — Cited evidence
Flag an inaccuracy or submit a comparable account — Contribute or read how claims are verified in Methodology.