
§ 41 — Use-case analysis
Four years of Black Sea grain disruption expose resilience model blind spots
Four years of data from the Black Sea grain corridor reveals where supply-chain resilience models systematically overestimate substitution speed and recovery timelines, giving evaluators a real-world stress test to benchmark their disruption-modeling tools.
- Function
- logistics
- AI technique
- forecasting
- Failure pattern
- substitution-overestimation
- Evidence source
- Rabobank/RaboResearch, IFCHOR Galbraiths, Miller Magazine
By July 2026, the Black Sea grain corridor was no longer a clean recovery story. It was a live stress test. After a period in which Ukraine’s seaborne exports had partly rebuilt, market participants reported that 30–40% of vessels were being canceled or delayed as attacks around the corridor changed the risk calculation for owners, charterers, insurers, and crews.[1] That is the point at which the phrase “black sea grain exports choke effect supply chain” becomes useful, if used carefully: not as a standard economic term, but as a practical modeling shorthand for simultaneous constraints that reduce recoverable export flow.
The important word is simultaneous. A port can be technically open while vessels stay away. A river route can exist while its cost makes it a crisis-only option. Grain can be available inland while the financing needed to move it stops before the farm-to-port leg. A resilience model that treats those as separate, sequential frictions will usually predict a faster recovery than the corridor can actually deliver.
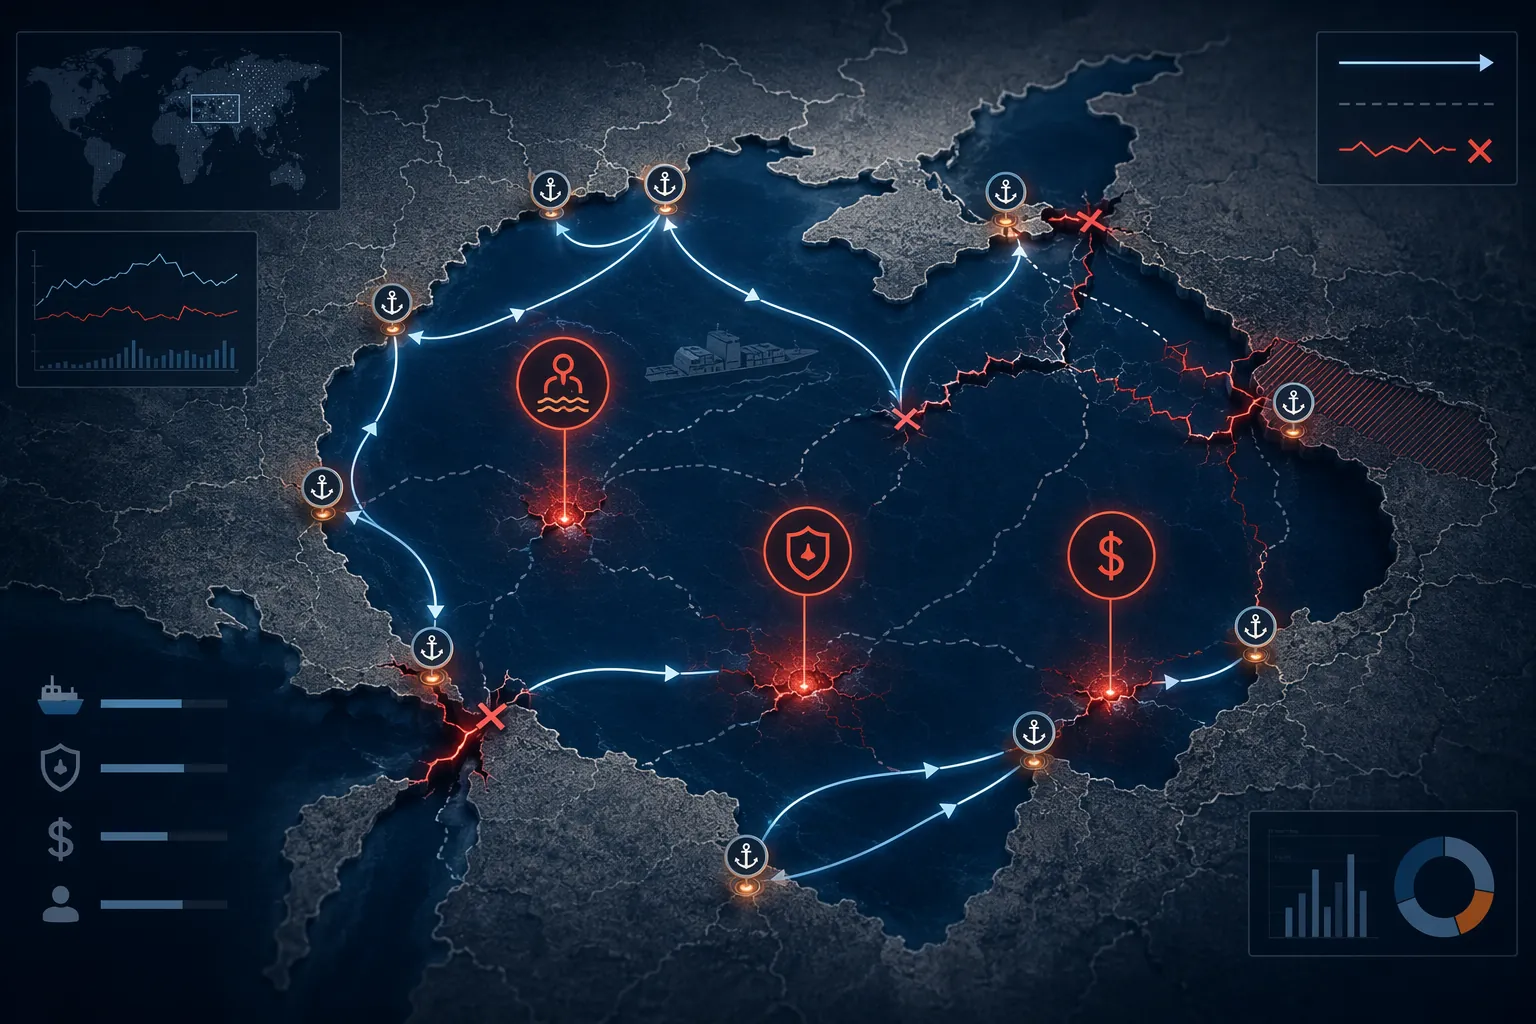
The July re-escalation also makes one uncomfortable fact hard to smooth over: crew-fatality risk changes behavior faster than port-capacity estimates do. Freight systems are not just steel, berths, drafts, railheads, and storage. They are also people deciding whether a voyage is acceptable, underwriters repricing that decision, banks narrowing which leg they will finance, and exporters discovering that “available route” does not mean “usable route.”
Four Operating Regimes, Not One Disruption
The Black Sea case is unusually useful because it does not give evaluators a single shock followed by a single recovery curve. Since 2022, the same export system has moved through four distinct operating regimes: the initial blockade after Russia’s full-scale invasion, the Black Sea Grain Initiative corridor from August 2022 to July 2023, the Ukrainian corridor’s partial recovery from August 2023 through June 2026, and the renewed July 2026 disruption.[2]
| Regime | Planning Variable That Changed | Why It Matters For Models |
|---|---|---|
| 2022 total blockade | Seaborne corridor availability collapsed | Tests whether the model can switch from normal routing to constrained substitution rather than assuming delayed but intact flow |
| August 2022-July 2023 BSGI corridor | A monitored corridor reopened part of the export channel | Tests whether recovery is modeled as conditional access, not full normalization |
| August 2023-June 2026 Ukrainian corridor partial recovery | Ukraine rebuilt a working corridor, with export volumes still below pre-war levels | Tests whether the model can represent partial recovery without declaring the disruption solved |
| July 2026 re-escalation | Vessel cancellations, war-risk insurance, and safety concerns rose again | Tests whether the model can degrade a recovered corridor quickly when human-risk and insurance variables move |
That sequence is more valuable than a one-off incident report. A model can be tuned after a blockade. It is harder to fake competence across blockade, supervised reopening, self-managed partial recovery, and renewed shock. Each regime asks a different question: can the system reroute, can it reopen under constraint, can it recover only partially, and can it relapse when the physical route still exists?
The Ukrainian corridor’s partial recovery is the easiest stage to misread. By early 2026, the corridor was often described as functioning, and exports had recovered materially. Rabobank/RaboResearch still forecast Ukraine’s 2025/26 grain exports at about 40 million metric tons, plus 15 million metric tons of oilseeds, around 20% below a pre-war baseline.[3] “Working,” in other words, did not mean restored.
The Substitution Routes Were Real, But Not Elastic
Most disruption demos handle route substitution elegantly. The primary corridor turns red; the model lights up alternatives; volume moves through the least-cost remaining path. The Black Sea data is a useful antidote because the alternatives existed, carried meaningful tonnage, and still could not behave like spare capacity.
The Danube-Constanta route is the clearest example. Rabobank/RaboResearch reported that the route peaked at about 14 million metric tons per year, but carried an AUD $50–100 per metric ton cost penalty.[3] That is not idle capacity waiting to be activated. It is a higher-cost emergency corridor with a practical ceiling. In a model, the difference matters because the question is not whether the route exists; it is how much displaced flow it can absorb, after what lag, at what margin damage, and for which exporters.
Rail looked even less like a bulk substitute. Rabobank/RaboResearch put rail flows at roughly 200,000–400,000 metric tons per month, or 5–10% of total export flow, with EU tariff-rate quotas limiting the practical expansion.[3] Trucking existed but was negligible at bulk grain scale.[3] These are not rounding errors for the exporter sitting on inventory, but they are also not the kind of capacity that replaces a deep-sea corridor.
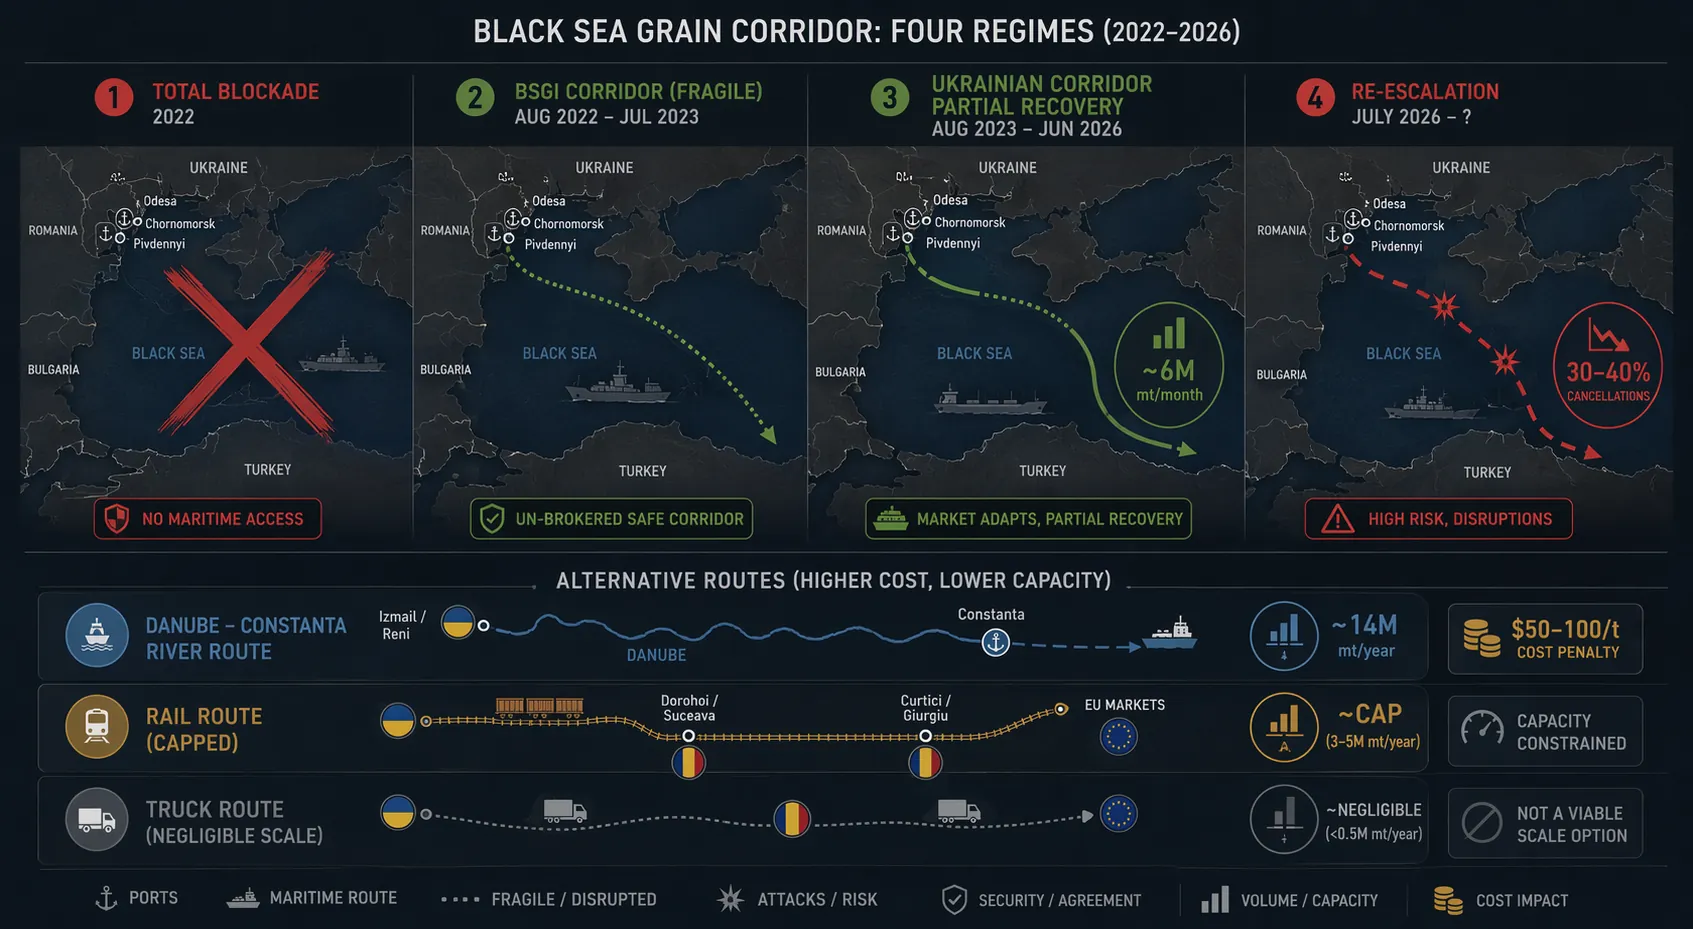
This is where a lot of planning systems quietly import optimism. They recognize substitution, but not substitution quality. They can represent a river leg, a rail leg, and a truck leg, yet still overstate resilience if the model treats them as scalable lanes with tolerable economics. A lane with a known ceiling and a large cost penalty is not equivalent to an available route with unused capacity.
The cost point should be handled conservatively. The Rabobank/RaboResearch penalty is reported in Australian dollars, and conversion into U.S. dollars would require an exchange-rate assumption that is not part of the cited estimate.[3] But conversion is not needed to understand the modeling implication. The penalty is large enough to separate emergency movement from normal commercial substitution.
The Missing Variables Sit Between The Port And The Balance Sheet
The renewed 2026 disruption exposed bottlenecks that are awkward for tidy corridor models because they are not just infrastructure states. They sit between human safety, insurance pricing, working capital, and inland accumulation.
War-risk insurance is the easiest to quantify. IFCHOR Galbraiths reported that Black Sea war-risk premiums had risen from around 0.25% to about 3.5% of hull value by July 21, 2026, a 14-fold increase that could add hundreds of thousands of dollars per voyage.[2] The exact premium trajectory varies by source and date, so the point is not that 3.5% is a permanent parameter. The point is that the variable can move fast enough to invalidate a route that still appears open in a network graph.
Crew risk is harder to reduce to a clean coefficient, but July 2026 made it operationally visible. Miller Magazine, citing S&P Global Energy and market participants, reported 30–40% vessel cancellations or delays as attacks escalated and ships stayed away.[1] Because the vessel-cancellation figure relies partly on market participants, it should not be treated as independently audited corridor telemetry. It is still the kind of signal a resilience model has to ingest if it claims to represent maritime disruption. The crew asked to sail does not experience “route availability” as an abstract edge weight.
The inland finance constraint is less visible in port dashboards, which is one reason it matters. GTR’s January 2025 analysis described a trade-finance gap in which foreign banks were more willing to cover the port-to-buyer leg than the farm-to-port accumulation leg.[4] That distinction can decide whether grain reaches the vessel at all. If financing stops before inland collection, then port capacity, berth windows, and vessel nominations can all look better than the physical flow will be.
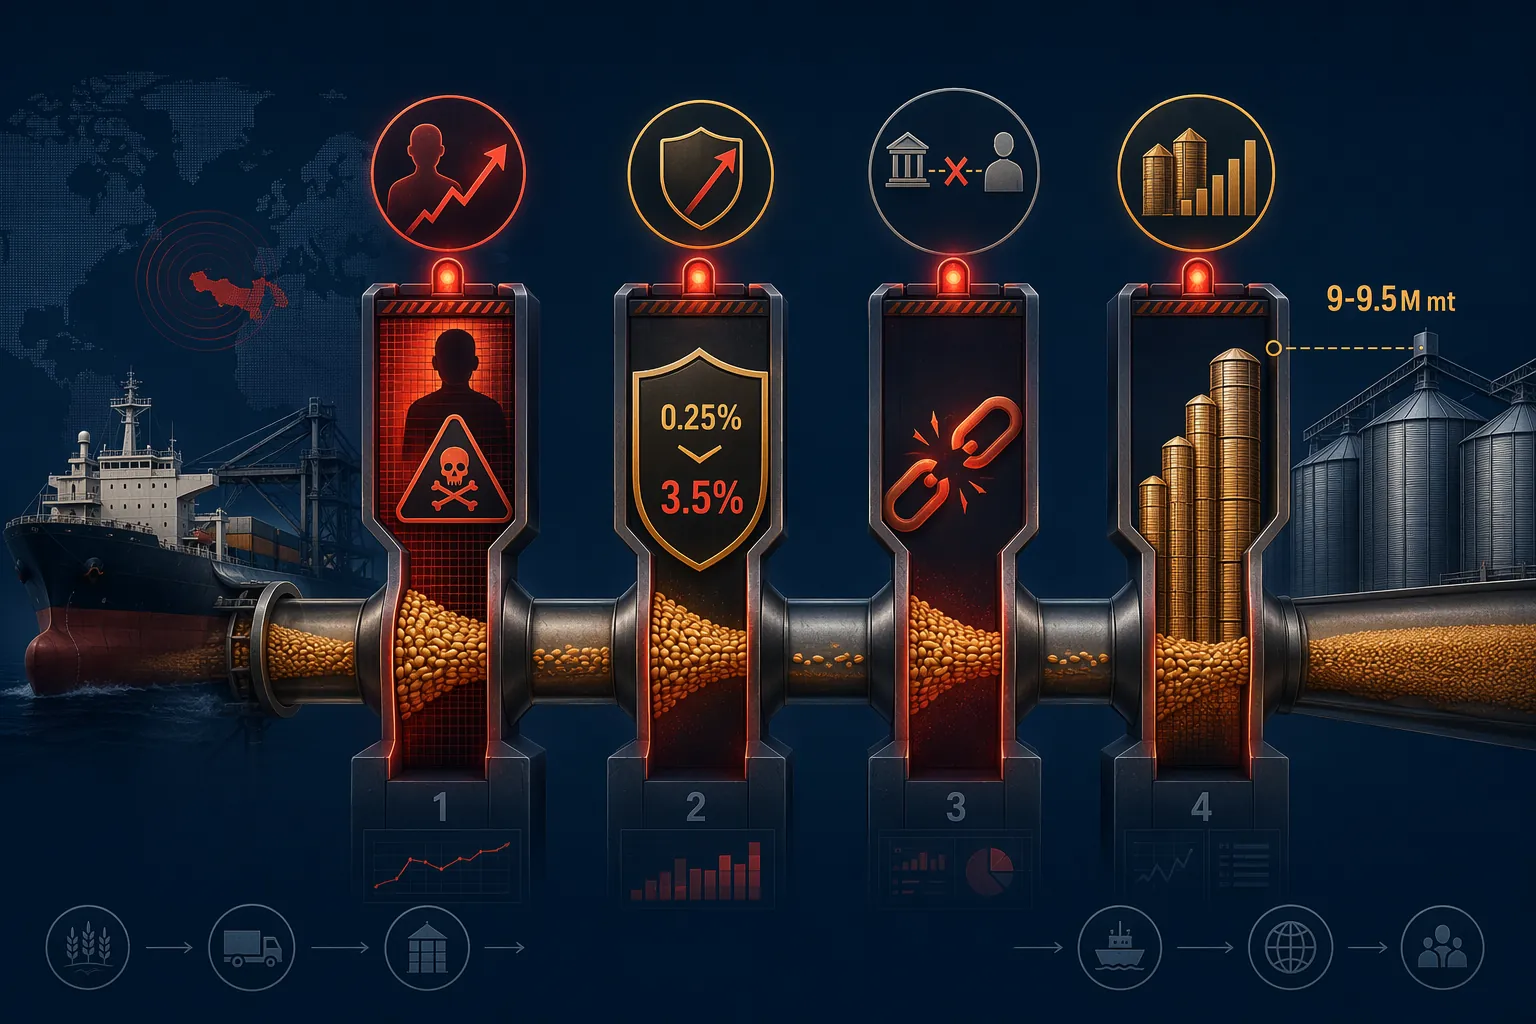
Carryover stocks show the consequence. APK-Inform, cited by Reuters, projected Ukraine’s carryover grain stocks at 9–9.5 million metric tons by July 2026, up from about 7 million metric tons a year earlier, because logistics could not clear available supply.[5] That is the mismatch a model should be punished for missing: the system is producing exportable grain, a corridor may be partly operating, and yet inventory backs up inland because the connecting constraints do not clear.
Port damage compounds the problem, especially when the damaged assets are specialized. Reuters reported that Ukrainian port terminals had suffered about $1.5 billion in losses since the war began, citing Ukrainian Agrarian Council deputy head Denys Marchuk, and noted that specialized equipment is not quickly replaceable.[5] For scenario tools, the relevant detail is not simply “terminal damaged.” It is whether the model distinguishes generic capacity loss from the loss of equipment that creates a repair and replacement lag.
Partial Recovery Is The Hard Part To Model
The Black Sea corridor did not fail in the neat way planning models prefer. It was blocked, then partly reopened, then adapted around, then hit again. That pattern matters because many resilience evaluations still focus on whether a tool can identify alternate routes or run a scenario quickly. Speed of scenario generation is useful. It is not the same as modeling recovery behavior.
A serious benchmark would ask the tool to preserve several uncomfortable states at once:
- The main corridor can be operational but still below pre-war export performance.
- Alternative routes can carry volume while remaining too costly or capped to absorb displaced flow.
- Vessel availability can deteriorate because crews, owners, and insurers reprice risk before port capacity disappears.
- Inland inventory can accumulate even when the seaborne leg is technically open.
- Repair timelines can depend on specialized terminal equipment, not just aggregate port-capacity percentages.
These are ordinary constraints for the people operating the corridor. They are not ordinary enough in software demonstrations. A model that routes around a disruption but fails to price crew danger, insurance escalation, bank appetite, quota caps, and terminal-equipment replacement will look decisive while quietly overstating recoverable flow.
The wheat-price reaction and wider food-security consequences are real, but they are not the best diagnostic for the systems question. Prices aggregate many signals. The sharper test is upstream: when the corridor is shocked, does the model predict which tonnage moves, which tonnage waits, which cost is absorbed, and which constraint becomes binding first?
What To Ask Of A Resilience Model After Black Sea
No public vendor-specific post-mortem is available to say that one planning platform handled the Black Sea corridor well and another did not. The useful move is not to turn this into a vendor scorecard. It is to turn the corridor into a benchmark case that is hard to pass with polished substitution logic alone.
The benchmark should begin with the four-regime sequence, not a single disruption snapshot. Feed the model a total blockade, a supervised partial reopening, a self-managed recovery corridor, and a renewed shock after apparent stabilization. Then inspect whether the tool assumes recovery once a route reappears, or whether it can hold the system in a degraded-but-functioning state for months.
The second test is substitution elasticity. Danube-Constanta, rail, and truck should not be represented as interchangeable overflow lanes. Their ceilings, costs, quotas, and scale limits need to bind. If the model can move displaced Black Sea volume through alternatives without showing margin damage, delay, or inland accumulation, it is probably modeling geography rather than logistics.
The third test is whether non-physical bottlenecks can stop physical flow. Crew-fatality risk, war-risk insurance, and trade finance are not soft context around the network. In this case, they are route-capacity variables. A vessel that is canceled, a voyage that becomes uneconomic, or a stockpile that cannot be financed into position has the same practical effect as a missing lane: grain does not move when the model said it could.
That is the main lesson from four years of Black Sea disruption. The corridor did adapt, but adaptation was partial, costly, lagged, and repeatedly vulnerable to constraints outside the visible port map. Any supply-chain AI or scenario-planning tool claiming disruption resilience should be tested against that pattern before its output is trusted in a room where someone has to explain why a theoretically available route is economically unusable.
References
- Escalating Black Sea attacks disrupt grain exports, lift global wheat prices, Miller Magazine, July 21, 2026.
- Black Sea grain under pressure: what prolonged disruption could mean for freight markets, IFCHOR Galbraiths, July 21, 2026.
- Will Ukraine be able to export all of its grain in 2026, Rabobank/RaboResearch, March 2026.
- Analysis: Trade finance and supply chain challenges for Ukraine's grain exporters, GTR, January 2025.
- Focus: Russian attacks could cut Ukraine grain exports by a third, Reuters, June 18, 2026.
§ 42 — Cited evidence
Flag an inaccuracy or submit a comparable account — Contribute or read how claims are verified in Methodology.