§ 41 — Use-case analysis
Which AI Capabilities Address Specific Hurricane Disruption Patterns?
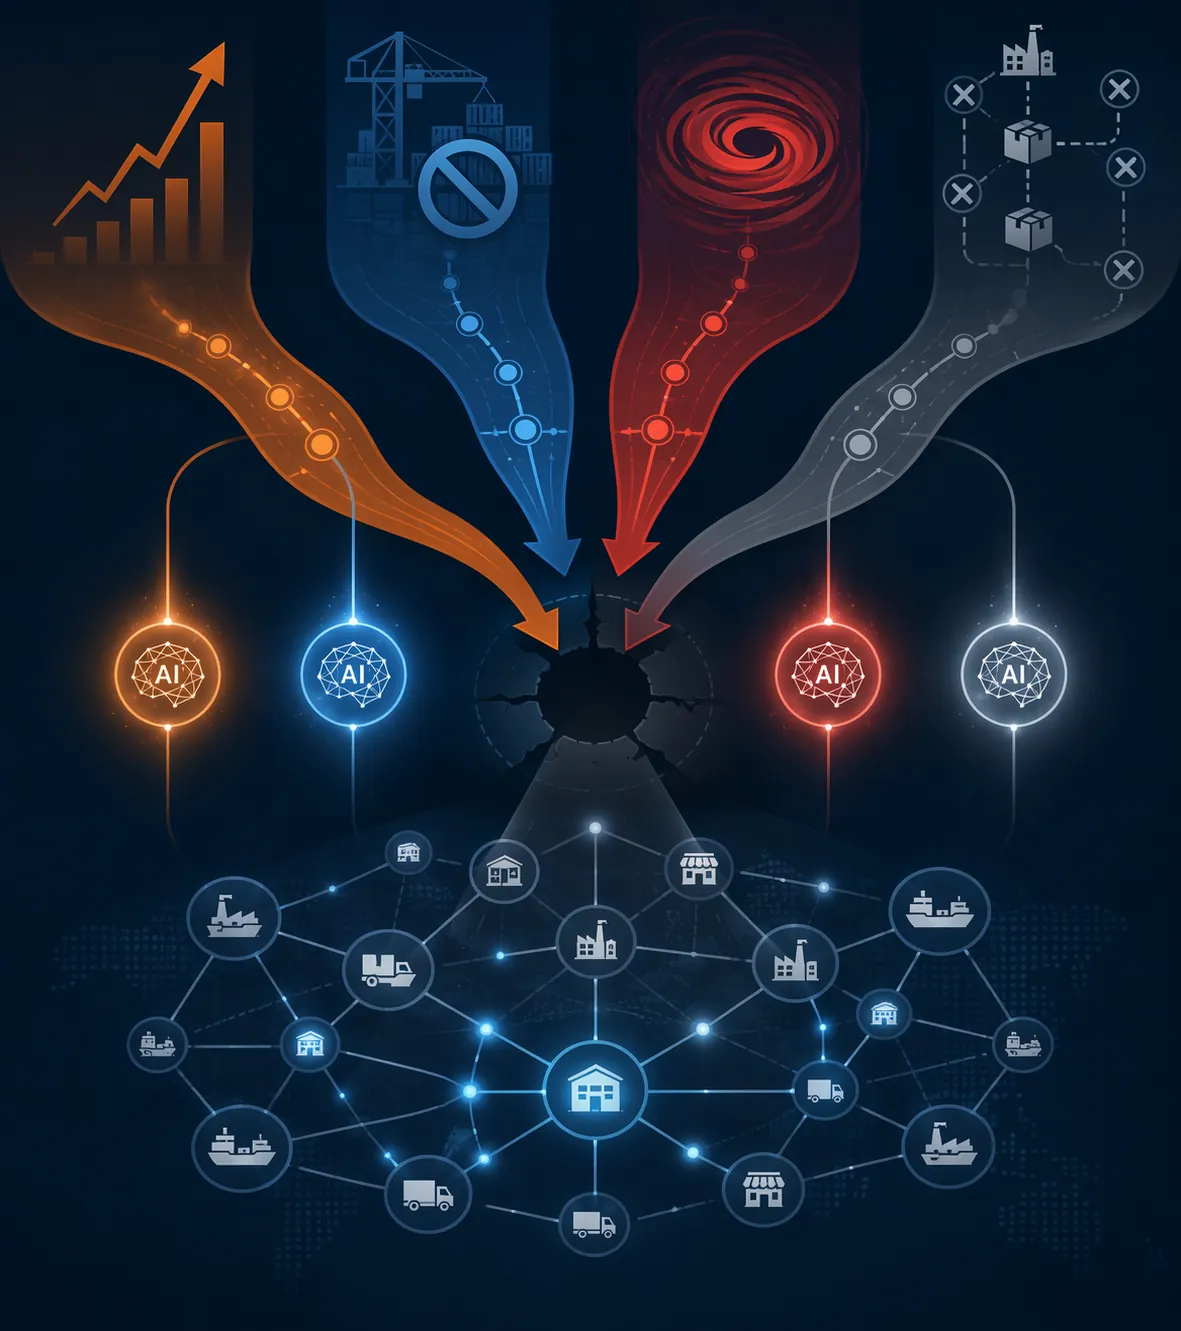
Four recent hurricanes (Helene, Ian, Milton, Harvey) reveal distinct disruption patterns—demand surges, port closures, rapid intensification, and multi-tier supplier failures—that map to different AI capability classes. The evidence shows single-pattern prediction works in production, but cascade prediction across simultaneous disruptions remains an unproven gap that separates vendor claims from reality.
- Function
- demand forecasting
- AI technique
- forecasting
- Failure pattern
- cascade prediction gap
- Evidence source
- ClimateAi, ORMS Today, Everstream Analytics
Hurricane supply chain disruption planning sounds like one problem until the storm arrives. Then it separates into very different decisions: whether roofing-material demand will jump before landfall, whether a Gulf or Atlantic port will close under Coast Guard Zulu condition, whether a storm is strengthening too fast for the normal planning cadence, and whether a supplier several tiers below the contracted vendor has just become the real constraint.
Those are not interchangeable use cases. A demand-sensing model does not, by itself, protect a single-port routing plan. A port-closure alert does not reveal tier 3 exposure. A supplier-risk graph does not buy back the hours lost when a tropical depression becomes a Category 5 hurricane in less than three days. Public evidence is strongest where AI is applied to one disruption pattern at a time. It is much thinner where vendors imply that several hurricane failure modes can be predicted as one connected cascade.
Hurricanes Do Not Break the Same Planning Variable
The first useful cut is not by vendor category. It is by the planning variable that changes soon enough for someone to act.
| Storm pattern | Planning variable that changes | AI capability class that plausibly fits | Evidence level in the public record |
|---|---|---|---|
| Ian-style pre-landfall demand surge | Regional demand, inventory allocation, sales and replenishment timing | Weather-to-demand translation and probabilistic demand sensing | Concrete vendor-published case with stated business outcome |
| Helene-style port Zulu closure | Port availability, route choice, transfer timing, stockout exposure | Logistics risk sensing, port-status monitoring, routing scenario analysis | Public operational analysis of multi-port versus single-port outcomes |
| Milton-style rapid intensification | Decision window, forecast cadence, escalation timing | Early disruption detection and high-frequency risk monitoring | Suggestive secondary claims, limited direct production proof |
| Harvey-style multi-tier supplier exposure | Hidden supplier dependency, upstream location risk, recovery sequencing | Multi-tier supplier mapping and scenario modeling | Capability evidence, but no public end-to-end hurricane cascade proof |
This distinction matters because a platform can look complete on a dashboard while still being incomplete at the moment a planner has to choose. If a system flags storm risk but cannot translate that risk into product-level demand, it may be too vague for allocation. If it sees a port closure but has no supplier-tier context, it may route freight toward an inventory pool that cannot be replenished. If it detects a supplier problem but only after the storm has tightened the transportation network, the warning becomes an explanation rather than an option.
Ian Shows the Clearest Public Case for Weather-to-Demand Translation
The strongest documented example is ClimateAi’s Hurricane Ian case study, published in March 2023. ClimateAi said its system identified a 30% to 50% elevated hurricane risk before Ian formed, then helped a roofing-materials producer anticipate demand in exposed regions before the normal signal would have appeared in sales history. The company attributed $15 million in incremental revenue to that forecast-driven move.[1]
That is a useful example because it names the chain of action. The storm signal did not merely say “bad weather ahead.” It became a commercial planning signal for roofing demand. That distinction is where AI can earn its keep: not by predicting that a hurricane may matter, but by identifying which products, regions, and time windows are likely to move before the demand spike hits the order book.
The boundary is just as important. The $15 million figure is vendor-published and not presented in the public record as an independently audited result. It supports a narrower claim: weather-to-demand translation can produce operationally meaningful decisions in a specific hurricane-demand pattern. It does not prove that the same system can predict port closures, supplier failures, or the interaction among them.
For a planning director, that still counts for something. Ian-style demand surge is one of the rare hurricane use cases where the public example connects the forecast to a planning action and then to a stated business outcome. A buyer evaluating a similar capability should ask to see that same chain: pre-formation or pre-landfall signal, product or category translation, allocation decision, and measured result. A tropical-risk heat map alone is not the same capability.
Helene Turns Weather Risk Into a Routing Test
Helene illustrates a different failure mode. The relevant event for supply chain planning was not only the storm track; it was the Coast Guard Zulu declarations at Port Tampa Bay and Port Canaveral. Under Zulu condition, port operations are effectively shut down as the storm approaches. INFORMS’ ORMS Today analysis reported that companies with multi-port alternatives maintained supply, while single-port routing contributed to stockouts.[2]
That is not a demand-sensing problem. It is a routing-resilience problem with a hard cutoff. Once the port status changes, the question becomes whether freight can be diverted, whether inventory is already staged in the right place, and whether the alternative lane is real or only theoretical. A model that forecasts demand accurately but assumes the same inbound path may leave the planner with the correct need and no executable route.
The practical test is uncomfortable but simple: show the lane that changes. A logistics risk system should be able to represent port availability, alternate ports, inland transport capacity, transfer timing, and the service consequence if the original port is unavailable. The useful output is not “Helene creates risk.” It is “this port closure removes this route, these SKUs or customers are exposed, and these alternatives remain feasible before the cutoff.”
This is also where a broad AI-risk platform can be misleading. If the system places a port alert beside a demand alert, that does not mean it has solved the routing decision. The planner still needs to know whether the platform can run scenarios across real lanes, inventory positions, and lead times. Helene’s lesson is not that AI must predict every closure earlier than the Coast Guard. It is that a closure converts a forecast into an availability constraint, and the system must treat it that way.
INFORMS’ same hurricane-season planning discussion also points to a 25% to 35% safety-stock increase as a benchmark during hurricane season.[2] That number is useful as a planning reference, not as a substitute for routing intelligence. Extra inventory in the wrong node, behind the wrong port, or dependent on the wrong upstream supplier can still become stranded inventory.
Milton Compresses the Decision Window
Milton adds a timing problem. The storm intensified from tropical depression to Category 5 in 49 hours, compressing the normal rhythm of meetings, forecast reviews, supplier calls, and transportation cutoffs into a window that many organizations are not built to use well.
This is where early disruption detection sounds attractive. Secondary sources have attributed to Johnson & Johnson an AI system that detected 85% of major disruptions seven days ahead. That claim is worth noting, but it should be treated carefully because the available public material does not include direct J&J reporting or an independent hurricane-specific post-mortem.
The capability class is still relevant. Rapid intensification punishes weekly planning cycles and slow escalation rules. A system that can monitor changing meteorological, logistics, supplier, and demand signals more frequently than the standard cadence may give a team time to move from “watch” to “act” before the final forecast package. But the production proof needed here is specific: what disruption was detected, how many days or hours earlier than the existing process, and what decision changed because of the alert.
Without that link, an early-warning metric can become a Monday-morning explanation. It may show that the system saw something coming, while the operation still lacked a route change, inventory move, supplier substitution, or customer-allocation decision that could be executed in time.
Supplier Risk Often Sits Below the Contracted Vendor
Harvey-style disruption brings the supplier map into the discussion. The first-tier supplier view can look calm while the real dependency sits at a sub-tier facility, a regional material source, or a logistics node shared by several upstream firms. Everstream cites Veridion data indicating that 85% of risks reside in tier 2 through tier 4 suppliers.[3]
That number changes the buyer’s question. It is not enough to ask whether the platform has supplier-risk scoring. The question is whether it can map exposure below tier 1 and connect location-based risks to the parts, materials, or finished goods that depend on them. Everstream describes scenario-building capabilities using more than 40 location-based risk types, which is the kind of mechanism intended to expose hidden geographic and supplier dependencies before a disruption reaches the contracted vendor.[3]
The mechanism is credible as a capability class: map suppliers beyond tier 1, attach locations, model hazards, and test scenarios against the network. The public evidence does not justify a broader claim that multi-tier supplier AI has already proven end-to-end hurricane cascade prediction in production. It supports a narrower and still valuable point: many hurricane exposures are invisible if procurement only monitors named first-tier suppliers.
For procurement managers, this is where hurricane planning stops being a seasonal logistics exercise and becomes a data-governance problem. If the platform cannot identify where the sub-tier exposure is, no amount of polished risk scoring at tier 1 will tell the planner why supply disappears after the obvious supplier remains open.
The Platform Claim Has to Match the Disruption Pattern
Once the four patterns are separated, the vendor conversation gets sharper. A system may be strong in one lane and weak in another. That is not a failure; it is only a failure if the buyer is sold one capability as if it covers all hurricane disruption.
| If the main risk is... | Ask for proof of... | Do not accept as equivalent... |
|---|---|---|
| Pre-landfall demand surge | Weather-to-demand translation by product, region, and time window | Generic storm-risk scoring |
| Port closure or port Zulu condition | Alternate routing scenarios tied to port availability and inventory position | A weather alert placed next to a transportation dashboard |
| Rapid intensification | Earlier escalation than the existing forecast-review cadence, plus a changed operational decision | A retrospective alert with no action taken |
| Multi-tier supplier failure | Tier 2-4 mapping, location exposure, and part or material dependency | Tier 1 financial or compliance scoring alone |
| Simultaneous cascade | Documented production case across demand, logistics, and supplier constraints at the same time | Several single-pattern modules displayed together |
This storm-level mapping fits inside the broader Prevention, Preparedness, Response, and Recovery frame covered in AI for supply chain disaster recovery planning. The difference here is the level of evaluation. A disaster-recovery framework tells the organization where capabilities belong. Hurricane-pattern mapping tests whether a specific system has evidence for the actual disruption it claims to handle.
Where the Public Evidence Stops
The public record supports single-pattern capability better than cascade capability. ClimateAi’s Ian case is the clearest production-style example for weather-to-demand translation, with the caveat that the revenue result is vendor-published. Helene’s port-closure analysis shows why routing alternatives matter, but it is not a proof point for a specific AI product. Milton supports the need for faster sensing, while the public AI-detection claims around J&J remain secondary rather than directly documented. Everstream-style multi-tier modeling explains how hidden supplier exposure can be surfaced, but not that a system has publicly demonstrated full hurricane cascade prediction.
That gap is the useful differentiator. The hard production question is not whether a vendor can show a weather model, a supplier graph, a port alert, and a demand forecast on the same screen. It is whether the system has handled a real event where demand surged, a port closed, a storm intensified faster than the planning cycle, and a sub-tier supplier constraint appeared in the same decision window.
Until that is documented, buyers should give credit for proven single-pattern applications and draw a firm line around them. Ask which hurricane disruption pattern the system has handled in production, what source verifies the result, which planning variable changed, and whether the vendor can document simultaneous cascade prediction rather than several separate modules sharing a dashboard.
References
- Accurate Hurricane Forecasting Helps Roofing Materials Producer, ClimateAi, March 2023
- ORMS Today hurricane-season supply chain analysis, INFORMS ORMS Today, June 2025
- Scenario Planning for Supply Chain Risk Management, Everstream Analytics
§ 42 — Cited evidence
Flag an inaccuracy or submit a comparable account — Contribute or read how claims are verified in Methodology.