What the 2026 Oil Crisis Revealed About AI Planning
An analysis of how o9, Kinaxis, and Blue Yonder AI planning platforms performed during the 2026 Hormuz oil price shock, based on vendor-reported data and public evidence, revealing that while concurrent planning enabled rapid scenario re-evaluation, data integration gaps limited broader effectiveness.
On June 22, the most interesting number in AI planning was not an oil price. It was Kinaxis’s reported 1,400% surge in Oil & Gas scenario-planning activity on its platform, alongside a 306% cross-industry spike, followed by a 29–31% drop as companies recalibrated after the immediate shock.[1] That sequence is worth more than a victory-lap headline. It shows planning rooms doing what they do under pressure: opening the model again, changing the assumption, asking procurement what can move, asking logistics what now costs more, and asking finance how much margin just disappeared.
For anyone trying to understand how oil prices affected supply-chain AI planning during the 2026 Hormuz crisis, that is the useful entry point. The available evidence does not prove that AI “solved” the shock. It does show that concurrent-planning systems were used intensively when a slower batch S&OP cycle would have been a poor fit for the tempo of the event.
The external signal was genuinely unstable. The EIA’s July 2026 Short-Term Energy Outlook described Brent moving from a peak above $119/b to about $103, then about $85, and then below $70/b. It also reported production shut-ins peaking at 11.2 million barrels per day and global oil inventories falling by 5.1 million barrels per day in Q2 2026.[2] That is not one forecast error to correct. It is a sequence of operating assumptions becoming stale before the organization has finished distributing the last version.

The broader supply-chain context moved in the same direction. GEP’s Global Supply Chain Volatility Index rose from 0.09 in February 2026 to 0.57 in March, which it described as a three-year high directly linked to Middle East oil disruption.[3] The index is based on PMI survey signals, so it is not a direct oil-only disruption meter. Still, it helps explain why planning teams outside energy were suddenly rerunning fuel, freight, petrochemical, and demand assumptions at the same time.
The 1,400% Spike Was a Workload Signal, Not an Outcome Measure
Kinaxis’s June 22 activity data is the strongest quantified evidence in the public material because it measures planner behavior during a named disruption. It indicates that users did not wait for the next planning calendar slot. They used the platform to stress-test scenarios while the event was unfolding.[1]
That distinction matters. A usage spike is not an audited measure of savings, service-level protection, or margin preservation. It does not tell us whether a company chose the best alternate lane, whether procurement locked supply before a competitor, or whether a finance team avoided an earnings surprise. It tells us that the planning loop shortened enough for users to come back to the system at crisis speed.
In a batch process, the model is often treated as a periodic settlement mechanism: demand plan, supply plan, reconciliation, executive review. Under an oil shock, the question changes. A planner needs to know what happens if bunker fuel surcharges rise before customer orders soften, if resin costs move before price increases can be passed through, or if a supplier’s supplier is exposed to a logistics corridor that the first-tier supplier file does not capture. The value of concurrent planning is that those questions can be asked without waiting for a full sequential refresh.
That is where Kinaxis Maestro’s reported activity becomes relevant. The platform evidence supports a narrow but important conclusion: during the acute shock, users leaned heavily on scenario planning. It does not support a broader claim that the platform independently predicted the crisis or delivered superior financial outcomes across all users.
One Oil Shock, Three Different Planning Jobs
o9’s useful contribution is not a single performance number. Its “Hormuz Rollercoaster” framing separates the crisis into three operating phases: Day 0–2 as cost shock, Day 3–30 as supply shock, and Day 30–90 as P&L exposure.[4] That is closer to how the work actually arrives. The first meeting is rarely about elegant network redesign. It is about which assumptions have to be changed before the next shipment, next quote, or next allocation call.
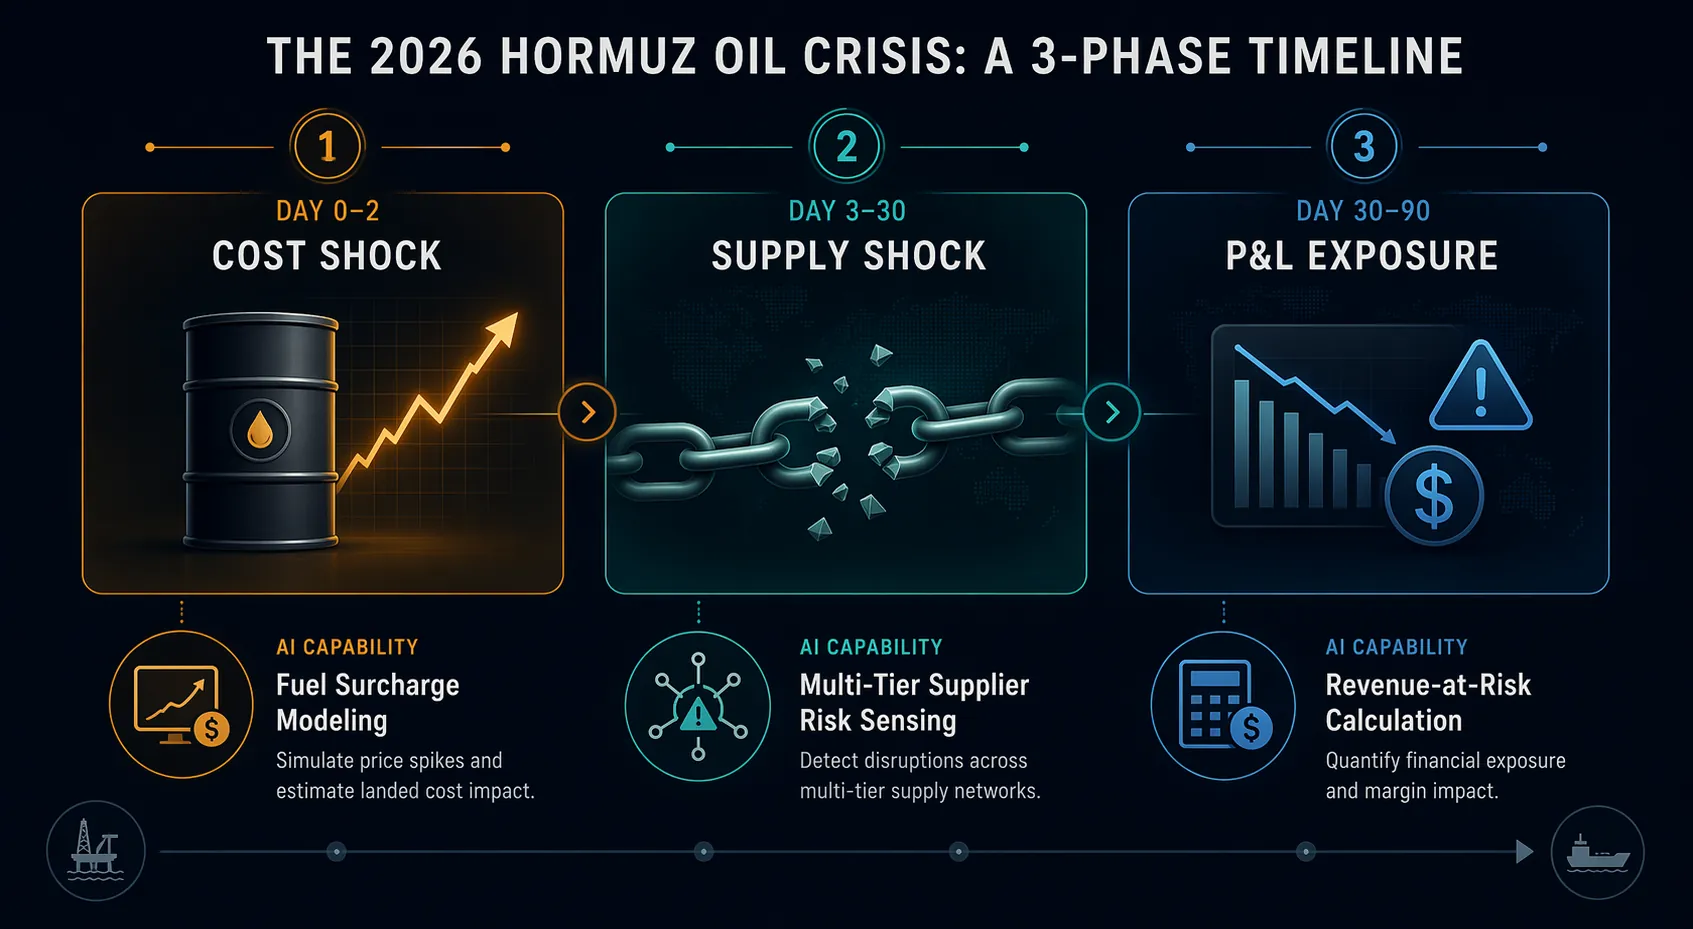
| Crisis phase | Planning question | AI planning capability that matters |
|---|---|---|
| Day 0–2: cost shock | Which lanes, inputs, and customer commitments are immediately exposed to higher oil-linked costs? | Fuel surcharge modeling and fast cost-to-serve scenario comparison |
| Day 3–30: supply shock | Which suppliers, tiers, ports, routes, or constrained materials create exposure beyond the first visible node? | Multi-tier supplier risk sensing and alternate-source scenario evaluation |
| Day 30–90: P&L exposure | Which revenue, margin, and service commitments remain at risk after the first operating changes? | Revenue-at-risk and margin-impact calculation across demand, supply, and finance assumptions |
The first phase is where speed is easiest to see. Oil moves, transportation assumptions move, freight surcharges move, and planners need a fast read on where the cost shock lands. The model does not need to be philosophically impressive here. It needs to let a logistics lead change fuel assumptions, see the lane impact, and hand finance a view that is not already obsolete.
The second phase is harder. Supply exposure is not the same thing as oil exposure. A direct supplier may look stable while its feedstock, packaging, component, or carrier exposure sits one or two tiers away. This is where agentic and concurrent planning architectures become more valuable if the underlying data is present: they can help planners test alternate sources, constrained materials, lead-time changes, and logistics substitutions in the same decision environment rather than across disconnected spreadsheets.
The third phase is where many crisis dashboards become less useful. By Day 30–90, the issue is no longer only whether diesel, ocean freight, or petrochemical inputs cost more. It is whether the company can protect revenue and margin while demand is still moving. o9’s P&L exposure framing is valuable because it places revenue-at-risk calculation inside the planning response rather than treating financial impact as an after-action report.[4]
Oil Price Scenarios Were Not Just an Energy-Sector Problem
The cross-industry spike in Kinaxis activity is important because oil-price shocks travel through more than direct fuel purchases. They move through freight contracts, petrochemical feedstocks, packaging, supplier working capital, customer demand, and sometimes pricing power. A retailer, manufacturer, logistics provider, or consumer goods company may not buy crude, but it still inherits crude-linked assumptions.
Blue Yonder’s Supply Chain Strategist documentation is relevant on this narrower point. Its product FAQ describes the ability to model a scenario such as “what if crude oil prices spike by 20%,” which confirms that oil-price-specific what-if modeling exists as a documented planning capability rather than a one-off custom exercise.[5] That is useful evidence of fit, but it is not crisis outcome evidence. The public material in the brief does not show how a named Blue Yonder customer performed during the 2026 Hormuz shock.
That limitation should not be treated as failure. Capability documentation answers one evaluation question: can the system represent the kind of scenario planners needed to run? It does not answer the next two: was the capability deployed in time, and did it change the decision?
The Ceiling Was Data Integration
The strongest platforms in this event were not simply the ones with better forecasting language. They were the ones that could connect oil price, fuel surcharges, freight lanes, resin or petrochemical inputs, supplier exposure, inventory positions, and revenue risk quickly enough for a cross-functional team to use the output.
That dependency is easy to understate. If fuel and freight live in one model, supplier risk in another, resin exposure in a procurement file, and demand sensitivity in finance’s workbook, the AI layer can still accelerate partial analysis. It cannot magically create an integrated operating picture. Under stress, partial speed can even create false confidence because the fastest model in the room may simply be the one with the thinnest set of constraints.
The older Shell example is useful only as an illustration of what the plumbing can make possible. A 2020 FutureBridge case study reported predictive models across more than 3,000 material types at more than 50 locations, reducing analysis time from 48 hours to 45 minutes.[6] That is not proof of 2026 Hormuz performance, and it should not be used that way. It does, however, show the kind of scale advantage that appears when material, location, and analytical data are already connected.
This is the practical dividing line for platform evaluators. A vendor demo can show a rapid oil-price scenario. A stronger implementation can show how that scenario changes freight cost, supplier feasibility, production allocation, customer service, and margin in one planning conversation. The second version depends less on the cleverness of the AI layer than on the dull, expensive work of harmonizing master data, mapping supplier tiers, and agreeing which financial measures the planning model is allowed to move.
What the Platform Evidence Can and Cannot Support
The public evidence is uneven, and that matters. Kinaxis provides the clearest quantified signal of platform activity during the named event. o9 provides the clearest phase-by-phase planning framework. Blue Yonder provides documented oil-price what-if capability. GEP and EIA provide the operating context that made rapid replanning necessary. Shell provides an older example of integrated-data scale, not a current Hormuz benchmark.
There are also things this evidence does not show. It does not identify named companies whose planning systems failed during the crisis. It does not provide independent audits of vendor-reported platform activity. It does not compare like-for-like customer outcomes across Kinaxis, o9, and Blue Yonder. It does not prove that agentic AI made better decisions than experienced planners; it shows that certain architectures helped planners cycle through assumptions faster.
That is still a meaningful result. During the Hormuz shock, speed had operational value because the relevant assumptions were changing faster than a conventional planning cadence could comfortably absorb. But speed was bounded by visibility. A model that cannot see multi-tier supplier exposure, oil-linked inputs, or revenue consequences is only fast inside its own blind spots.
Cristofaro’s Academy of Management Today framing puts the larger issue well: “oil shocks do not just disrupt supply chains; they quietly redraw the map of globalization.”[7] That is a structural claim, not a software scorecard. The software question is narrower: when the map starts moving, can the planning system help the organization redraw its own assumptions quickly enough to act?
For the 2026 crisis, the bounded answer is yes, but not universally and not automatically. Concurrent-planning and agentic AI architectures showed their visible advantage in faster scenario re-evaluation. Their practical ceiling was set by the integration and supplier-visibility layer underneath them.
References
- How the Iran conflict triggered a 1,400% surge in scenario planning, Kinaxis Blog, 2026.
- Short-Term Energy Outlook: Global Oil Markets, U.S. Energy Information Administration, July 7, 2026.
- GEP Global Supply Chain Volatility Index, GEP newsroom, March 2026.
- The Hormuz Rollercoaster, o9 Solutions, July 20, 2026.
- Blue Yonder Supply Chain Strategist product FAQ, Blue Yonder.
- Shell case study, FutureBridge, 2020.
- Energy shocks as supply-chain redesign catalysts, Academy of Management Today, 2026.
Cited evidence
- Why AI Traceability Failed in the 2026 Cyclospora Outbreak
The 2026 multistate cyclosporiasis outbreak — with over 1,645 confirmed cases and a 2.5-month FDA investigation lag — exposed a stark divide: AI-powered diagnostic screening identified cases at 3-4x human sensitivity, but the produce supply chain still lacks the lot-level digital traceability needed to pinpoint contamination. This case study examines what the outbreak reveals about AI's real limits in food safety today.
- AI Supply Chain Risk Management in the 2026 Oil Price Spike
This analysis maps how AI planning platforms from o9, Kinaxis, C3 AI, and Resilinc performed during the three phases of the 2026 Strait of Hormuz oil crisis, and identifies which capabilities mattered most—and which gaps remained.
- Are Forced Labor and Tariff Compliance One AI Planning Problem?
Forced-labor enforcement (UFLPA) and tariff volatility are structurally converging, yet most AI planning platforms still treat them as separate problems. This use-case analysis examines how Kinaxis, o9, Blue Yonder, Resilinc, and Interos handle dual-risk optimization and where the gaps remain for procurement decisions.
Ready to check your own team's readiness for this pattern?
See the demand planning readiness checklist →Spotted something inaccurate or incomplete in this entry? ChainSignal reviews corrections and additional evidence before publishing an update — this is not a public comment thread.
Flag an inaccuracy / submit evidence for this entry →